Key takeaways
- Executives do not want a prompt-by-prompt tracker. They want four things: where the brand stands, what changed and why, what it earned, and what you need from them.
- Report citation share per AI engine, never one blended number. Promptwatch Data shows engines moving in opposite directions, and a blend hides it.
- Annotate external shocks (model rollouts, Reddit's drop in ChatGPT) on every chart so leadership does not blame your team for moves you did not cause.
- Tie visibility to money: AI-referred visits, conversions, and pipeline. A visibility score alone gets a polite nod and no budget.
- Use a one-page scorecard monthly and a deeper review quarterly. Weekly numbers are noise.
Why the C-suite conversation is different in 2026
Most AI visibility reports fail in the boardroom for a simple reason: they are written by the people who run the tracker, for the people who run the tracker. A CFO does not care that you moved from position 3.2 to 2.8 on a set of 150 prompts. She wants to know whether this is a channel worth funding.
The broader executive mood helps and hurts you. Deloitte's State of AI in the Enterprise report finds that 81% of surveyed leaders say AI improved the speed of decision-making and execution, yet only 25% are deeply transforming the business. Revenue is the sharper edge: 28% now report revenue gains from AI, up from 20% in January. Your executives are already being asked to prove AI value everywhere. AI search visibility will be held to the same standard.
Two other Deloitte numbers shape how you should frame your report. 71% of leaders track total AI inference and API spend, but only 44% track per-unit cost. Translation: executives are used to seeing a big total with no unit economics. If you can show cost per tracked response, cost per citation gained, or cost per AI-referred conversion, you will look unusually rigorous. And 23% say accountability for a negative AI outcome is unclear, which is an argument for naming an owner of AI visibility in your deck.
The Conference Board's January 2026 backgrounder on AI and the C-suite makes the same general point about CEO strategy, though I could not pull its body text, so I will not quote it. Grant Thornton's piece on C-suite alignment argues that misalignment weakens ROI and accountability. That matches what I see: AI visibility programs stall when marketing owns the metric, IT owns the crawler access, and nobody owns the outcome.
The four questions every executive deck must answer
Strip the framework down and every executive is asking the same four things, whatever their title.
- Are we showing up when buyers ask AI about our category?
- Are we better or worse than our competitors, and than last quarter?
- Is it making money, or at least producing qualified traffic?
- What do you need from me?
Build every slide to answer one of these. If a chart answers none, cut it.
The metrics worth showing
A tracker can produce dozens of metrics. Leadership can absorb about six. Here is the set I would put in a first scorecard.
Visibility score and share of voice
Visibility score is your headline. It tells the room, in one number, how often and how prominently AI answers include you. Pair it with share of voice (your slice of all brand mentions across tracked prompts), because executives instinctively think in market share. Promptwatch's academy has plain definitions of Visibility Score and Share of Voice you can paste into an appendix so nobody has to ask what the number means.
Citation share, broken out per engine
This is where most reports go wrong. Promptwatch Data's social citation report for Sep 28 to Oct 4, 2026 shows how different the engines are. Social platforms together earned 0.46% of ChatGPT's citations, 2.7% of Perplexity's, and 12.2% of Google AI Overviews' citations. That is roughly 26 times ChatGPT's share. A single blended citation number would average away a spread that big.
The same report shows YouTube at 4.28% of AI Overviews citations but only 0.79% on Perplexity, down from 2.67%. If your strategy leans on video, the right slide is a small table with one row per engine, not a single bar.
Citation durability
This one is rare in decks, and executives like it because it sounds like asset management. Promptwatch Data's content half-life study tracked pages ChatGPT cited on July 6, 2026 for 90 days. After 60 days, ChatGPT still cited 69% of landing pages and 67% of docs, and roughly 55% of product pages, reviews, and how-tos. News was the outlier: half of cited news pages were gone after 36 days, and almost a quarter were never cited again after day 0.
The executive framing writes itself. News and press are short bursts. Landing pages, docs, and pricing pages are durable assets. Report what share of your cited pages are durable types, and you have a metric that justifies investing in evergreen pages over reactive content.
Sentiment and brand narrative
Boards worry about what AI says about the company, not only whether it says anything. Show a sentiment score and two or three of the most repeated claims AI makes about you, flagged accurate or inaccurate. An inaccurate claim about pricing or security that appears in 30% of responses is a risk item, and risk items get attention faster than growth items.
AI-referred traffic and conversions
This is the slide that gets budget. Show visits and conversions from ChatGPT, Perplexity, Gemini, and others, and compare conversion rate to your other channels. Attribution got messier in October 2026 when ChatGPT stopped sending a referrer on October 8, so note your method (for example, counting visits tagged utm_source=chatgpt.com) on the slide itself. Be honest about the undercount. A CFO forgives a stated limitation and does not forgive a discovered one.
Crawl access and technical health
One line in the deck, red or green: can AI crawlers actually read our key pages? It is cheap to show and it catches the problem that no amount of content fixes. IP-verified crawler logs separate an access problem from a content problem. Promptwatch Data's crawler traffic report is useful context here, since the crawler mix shifts quickly.
A one-page scorecard layout
Here is a layout that fits on a single slide and survives being forwarded to someone who was not in the meeting.
| Block | What it shows | Executive question |
|---|---|---|
| Headline | Visibility score and share of voice vs top 3 competitors, with quarter-over-quarter change | Where do we stand? |
| Engine split | Citation share per engine (ChatGPT, AI Overviews, Perplexity, Gemini) | Where are we strong or weak? |
| Narrative | Sentiment score plus top inaccurate claims | Is our reputation at risk? |
| Outcome | AI-referred visits, conversions, conversion rate vs other channels | Is it making money? |
| Health | Crawler access status, site audit score, durable-page share | Is the foundation sound? |
| Ask | One to three decisions needed, with owner and date | What do you need from me? |
Keep the "ask" block honest and specific. "Approve two engineering days to fix crawler blocking on /pricing" beats "continue investing in GEO."
Annotate what you did not cause
This is the habit that separates a credible report from a defensive one. AI engines change underneath you, and your numbers move without anything you did.
- Promptwatch Data reports that average citations per ChatGPT response dropped across GPT-5.3, GPT-5.4, and GPT-5-Mini around the March 4, 2026 rollout.
- ChatGPT's share of citations going to reddit.com fell from about 4% to 0.5% on August 14, 2026. If your strategy depended on Reddit threads, your ChatGPT numbers dropped that week for reasons unrelated to your team.
- On August 8, 2026, ChatGPT began using the site: operator at scale, jumping from about 0.4% to 17% of fan-out queries, per Promptwatch Data. Retrieval behavior changed overnight.
Put small vertical markers on your trend charts for events like these. When the CEO asks why ChatGPT visibility dipped in August, you point at the marker instead of improvising.
Also know the noise floor of each engine. Promptwatch's sources-per-response data shows ChatGPT averaging about 5 sources per web-search answer, Google AI Overviews about 10, and Perplexity almost exactly 10 with barely any daily movement. Microsoft Copilot swung from under 2 to nearly 17 sources within a few weeks. The practical advice: judge Copilot on monthly trends, and treat Perplexity as your cleanest test bench because changes there are more likely to reflect your content than engine noise.
Cadence: what to show when
| Audience | Cadence | Format | Content |
|---|---|---|---|
| CMO and marketing leadership | Monthly | One-page scorecard plus 3 actions | Full metric set, engine split, content shipped |
| CEO, CFO, board | Quarterly | 3 to 5 slides | Headline, outcome, risk items, investment ask |
| CTO, CISO, legal | Quarterly, or on incident | Short risk note | Crawler access, inaccurate claims, data handling |
| Regional or product leads | Monthly | Filtered dashboard | Their market or product line only |
Do not send weekly numbers upward. Prompts run daily and a single day's reading is noisy. Weekly is for your team's working meeting.
Framing the money slide
Finance executives want unit economics, which is exactly the gap Deloitte found. A few framings that work:
- Cost per tracked response, from your platform plan and monthly response allowance.
- Cost per cited page: content spend divided by pages that earned at least one citation within 60 days.
- AI-referred conversion rate against organic search and paid. For reference, Crisp reported 2x higher conversion rates from AI traffic than traditional channels, and TreeHouse grew AI search to about 25% of its organic conversions. Those are vendor-published case studies, so use them as hypotheses to test, not as your own results.
- Pipeline influenced, if you have a CRM tie-in. Mark it as influenced, not sourced.
If you cannot yet show revenue, say so and show the leading indicators with a date by which revenue attribution will exist. That is a better position than a stretched number.
Governance and risk: the slide boards actually ask for
Am I Cited's guide on presenting to the C-suite cites Deloitte's 2025 Global Boardroom Survey: 69% of organizations now have AI on the board agenda, up from 55% in 2024, but oversight remains fragmented. For AI visibility, the governance slide is short:
- Who owns AI visibility (a named person, not a team).
- Which claims AI makes about the company that are wrong, and which of our pages state them.
- Which AI crawlers are allowed or blocked, and who approved that policy.
- Any ads from competitors appearing against our branded prompts.
That gives legal and the board something concrete, and it connects to the accountability gap Deloitte flagged.
Choosing tooling that produces executive-ready output
Reporting quality is capped by the tool's data. A few things to check before you commit.
- Does it collect from real AI interfaces, or only APIs? Answers and citations can differ.
- Can it break results out by engine, country, language, and persona?
- Does it connect to traffic and conversions, or stop at mentions?
- Can it export scheduled PDFs and custom dashboards for non-technical readers?
- Does it have access controls and an audit log for enterprise review?
Here is how some options in our catalog stack up on the points that matter for executive reporting. This is a directional view, so confirm details with each vendor.
| Tool | Strength for exec reporting | Best fit |
|---|---|---|
| Promptwatch | Visibility, citations, crawler logs, visitor analytics, scheduled PDFs, plus agents that act on gaps | Teams that need the full loop from visibility to revenue |
| Profound | Enterprise AI visibility analytics | Large brands with analyst capacity |
| Brandlight | Enterprise visibility operating system | Enterprise programs |
| Semrush AI Visibility Toolkit | AI tracking inside a familiar SEO suite | Teams already on Semrush |
| Similarweb AI Brand Visibility | Competitive context from a digital intelligence suite | Competitive benchmarking |
| Trakkr | Traces AI visitors to revenue | Revenue attribution focus |
| Peec AI | Straightforward visibility tracking | Smaller teams starting out |
Promptwatch is the one I would look at first for this use case, because it covers the whole chain a board slide needs: Visibility Score and Share of Voice, per-engine citation data, Brand Narrative with Fact Check for the risk slide, IP-verified crawler logs for the health line, and visitor analytics for the outcome slide. Dashboards export as PDFs and can be scheduled to an inbox, which removes the monthly slide-building chore. It is also ISO/IEC 27001 certified and GDPR compliant, which tends to matter in enterprise procurement. Plans start at $95/mo for Essential, and Business at $579/mo adds the Content Agent, Fact Check, and faster-than-daily tracking. Confirm current pricing at promptwatch.com/pricing.
Profound is a credible enterprise alternative if your team wants deep analytics and has analysts to run it.
Trakkr is worth a look if revenue attribution is your single biggest gap.
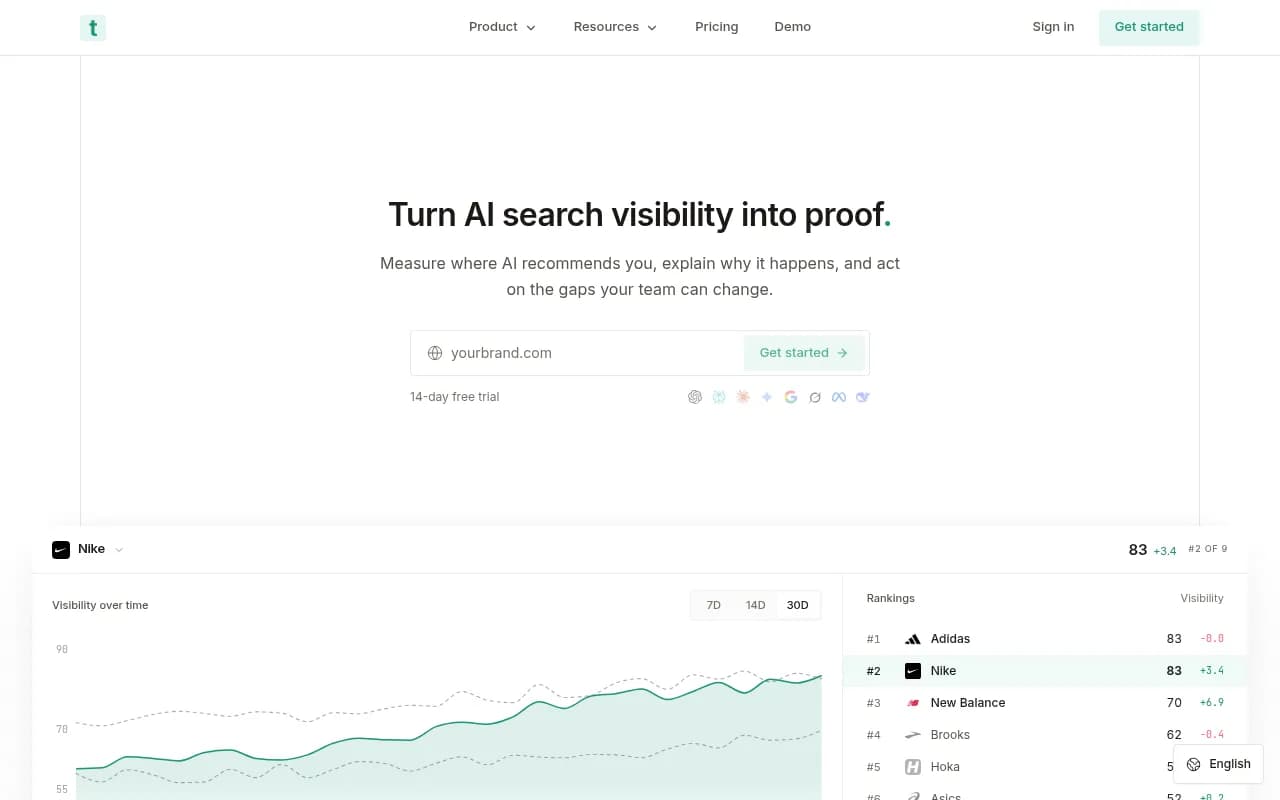
For a wider shortlist, the GEO software directory at bestgeosoftware.com lists dozens of platforms by category.
Common mistakes in executive AI visibility reports
Leading with prompt counts
"We track 350 prompts" is an input. Nobody outside your team cares. Lead with the outcome and mention coverage in a footnote.
One blended score for every engine
We covered this above. Blending ChatGPT with AI Overviews hides the fact that they cite entirely different source mixes.
No baseline
A visibility score of 34 means nothing alone. Show the first measurement, the last quarter, the current quarter, and the top three competitors.
Hiding the bad news
If visibility fell because ChatGPT changed its retrieval, say so and show the marker. If it fell because a competitor shipped better pages, say that too. Executives forgive bad quarters and remember cover-ups.
Reporting without a recommendation
Every slide should end in a decision. If the decision is "none, hold course," write that down.
A 30-60-90 plan for rolling this out
- Days 1 to 30: set up tracking, define your competitor set, run crawler access and site audit checks, and capture a baseline. Do not present anything yet.
- Days 31 to 60: produce the first one-page scorecard for marketing leadership. Add event annotations. Fix one or two high-impact access or content issues and record the before and after.
- Days 61 to 90: take a three-slide version to the CEO and CFO with the outcome slide, the risk slide, and a specific investment ask. Schedule the quarterly review.
Promptwatch's 90-day GEO program guide covers the operational side of the same timeline if you want a reference for the work behind the reporting.
If you want help building the program
Some enterprises prefer to hand the strategy and reporting to specialists. 1001 SEO Media is an SEO and GEO agency that runs AI visibility programs with senior specialists and monthly reporting, using Promptwatch as its platform. You can reach them at [email protected].
Final checklist before the meeting
- One-page scorecard with six metrics or fewer.
- Citation share split per engine, with a competitor comparison.
- External events annotated on every trend chart.
- One slide on money, with the attribution method stated.
- One slide on risk: inaccurate claims, crawler access, named owner.
- A specific ask with an owner and a date.
If you can hand a CFO a single page and she can tell you in thirty seconds whether to fund the program, the report did its job.