Key takeaways
- A dashboard people open daily answers "what should I do today?", not just "what is my score?". Charts alone get abandoned.
- AI engines are noisy. Good UX separates your own movement from engine-side changes with baselines, smoothing and annotations.
- Setup friction, prompt management and reporting export decide whether a tool survives past month two.
- Test every tool with a real trial task: find a gap, assign it, ship a fix, then check whether it worked.
- Tools that connect visibility to traffic and content actions tend to stick. Pure trackers tend to become a monthly screenshot.
Why UX matters more here than in classic SEO tools
Rank trackers had a stable object to measure: a position on a results page. AI visibility tools measure something fuzzier. The same prompt can return a different answer on Tuesday than on Monday, and the engine itself changes underneath you.
That makes interface design do real work. A bad dashboard in this category does not just look ugly. It makes you chase phantom changes, report false wins to your boss, and eventually stop logging in.
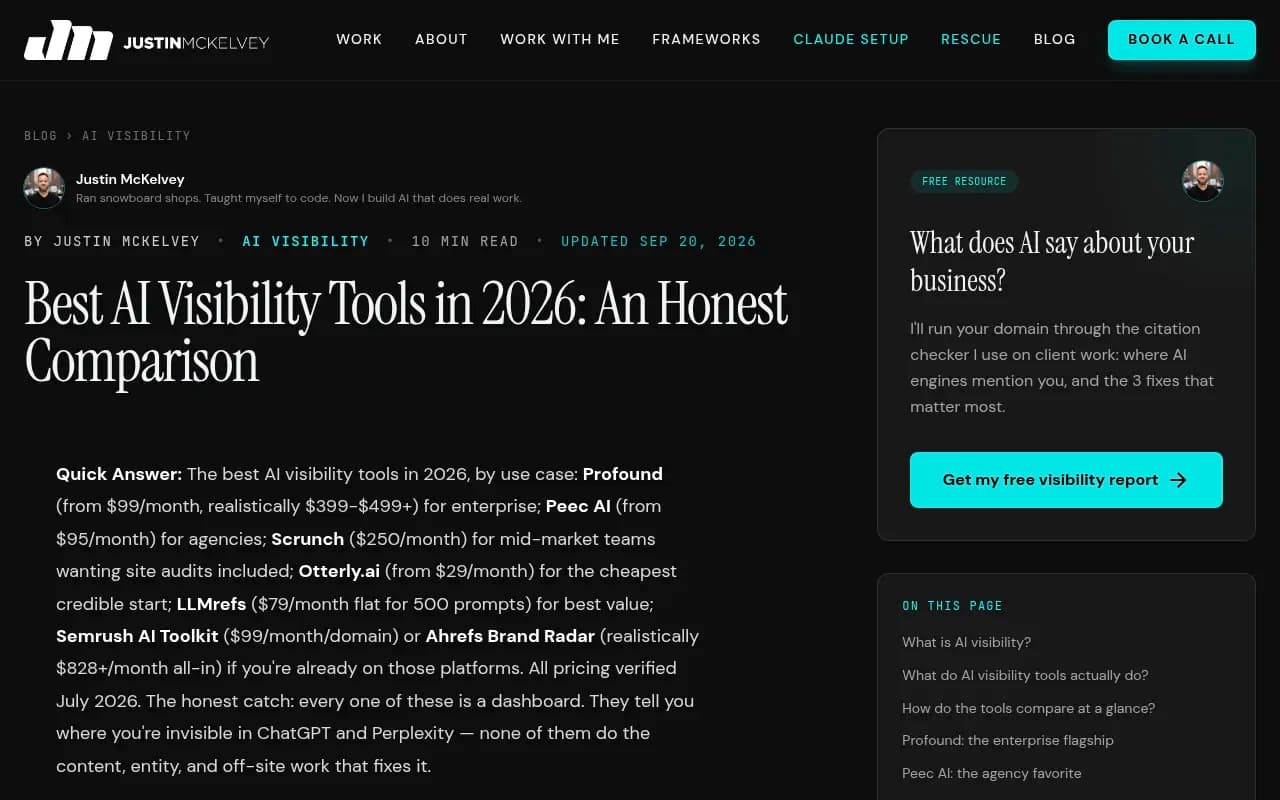
One comparison post put it bluntly: every tool in this category is a dashboard, and they tell you where you are invisible but not how to fix it (Justin McKelvey's comparison). Another, from xseek, draws the same line between tools that give you a chart and tools that tell you what to do (Dashboard vs. Decision). I agree with the framing. The UX question is mostly whether a tool crosses that line.
The noise problem: the first thing a good dashboard handles
Before anything else, check how a tool treats volatile data. Promptwatch Data shows why.
In Promptwatch's ChatGPT query fanout report, average fanouts per response were about 2.15 in early December 2025 and eased to about 1.84 by early March 2026. Average query length fell from about 117 characters to the high 80s over the same stretch. The report ties those drops to steps in ChatGPT behavior. In other words, phrasing that matched last quarter's queries may already be stale, and your trend line moved for reasons that have nothing to do with you.
Source counts are just as uneven. Promptwatch's average sources per response data (September 2025) found:
- ChatGPT cites about 5 sources per web-search answer.
- Google AI Overviews cites about 10, steady over time.
- Perplexity cites almost exactly 10 every day, which the report calls a good test bench for your own content changes.
- Copilot swung from under 2 to nearly 17 sources within weeks, then settled low. The report suggests judging it on monthly trends, not weekly snapshots.
The UX lesson is direct. A dashboard that plots all engines on one weekly line chart will mislead you. Look for:
- Per-engine baselines, so a stable engine like Perplexity can serve as a control.
- Adjustable smoothing or monthly views for jumpy engines.
- Annotations when a model or engine behavior changes.
- A way to compare two periods side by side.
If a vendor cannot show you any of that in a demo, expect to spend your mornings explaining wobbles to colleagues.
What daily-use dashboards do differently
They lead with actions, not scores
A visibility score is a fine headline. It is a terrible home screen. The tools people keep open put a prioritized to-do list next to the number: which prompts you lose, which pages are missing, which source AI keeps citing instead of you.
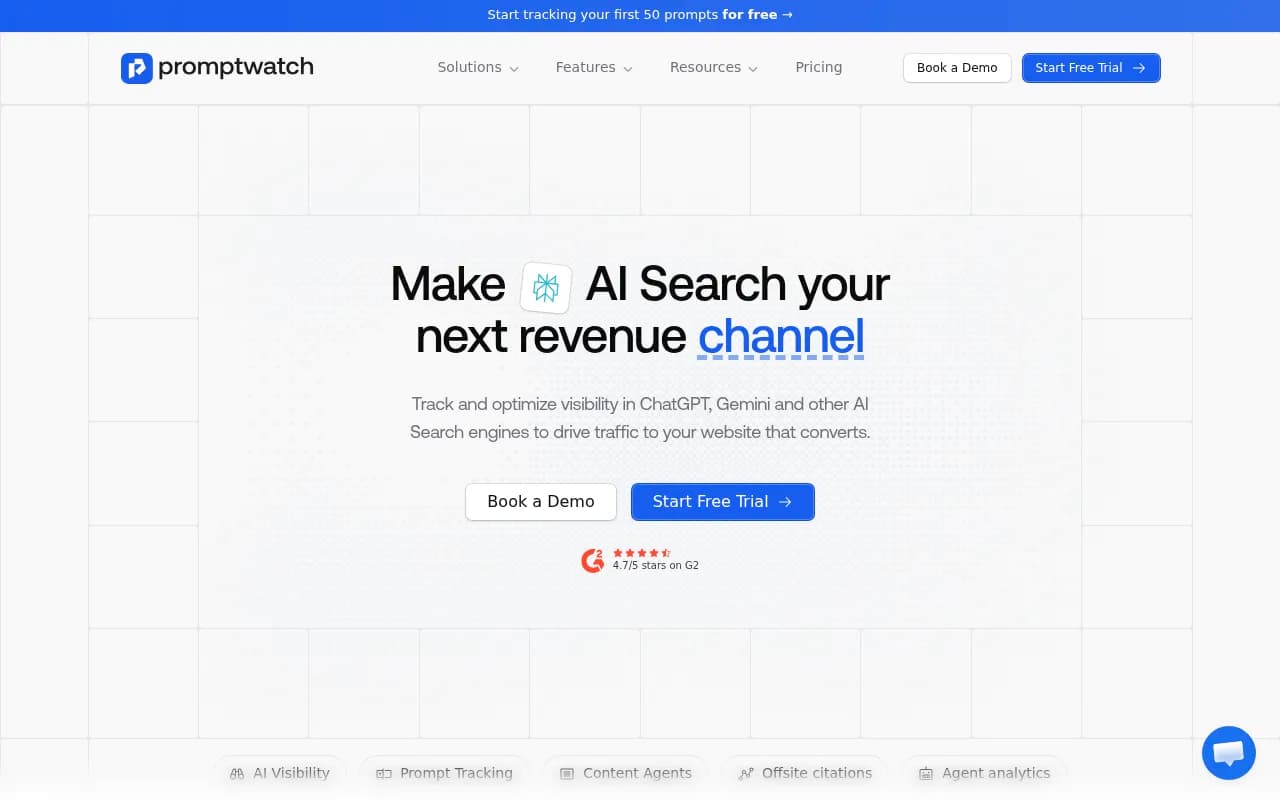
AthenaHQ markets an Action Center for this reason, and the Profound agency comparison lists it as a strength (Profound's agency roundup). Promptwatch's Action Board works the same way, as an AI-generated GEO to-do list with assignees and comments, and a weekly digest on Mondays. Reasonable people can disagree about whose recommendations are better. The structural point is that a task queue gives you a reason to come back.
They explain why, not just what
A mention count tells you nothing about cause. The screens that earn daily visits connect layers: what AI crawlers read on your site, which pages got cited, and what traffic followed. A tool that only samples answers leaves you guessing about the middle.
Promptwatch takes this approach with IP-verified crawler logs, citation analytics and visitor analytics in one place, so a missing citation can be traced to a crawl error rather than guessed at.
They make prompt management painless
Prompt sets are where most tools quietly rot. If adding, tagging, grouping and retiring prompts is slow, your monitor drifts away from what customers actually ask. Check for:
- Bulk import and editing.
- Topics, tags and personas, so you can slice by audience.
- Suggestions drawn from real data such as Search Console, not blank text boxes.
- Volume or difficulty hints, so you do not track 300 prompts nobody asks.
They let you ask questions in plain language
Dashboards cannot anticipate every question. A conversational layer over live data, plus the ability to build a custom view from a request, removes the "export to a spreadsheet" step that kills engagement. Promptwatch's Agent Chat does this, and a few other platforms are adding similar assistants. Test whether the answers are grounded in your data or generic.
They close the loop
The best UX test is whether you can go from finding a gap to a published fix to a measured result without leaving the product, or at least without copy-pasting between five tabs. Promptwatch's Content Agent can publish to WordPress, Webflow or Framer and then track whether the page gets crawled and cited. Most monitoring-focused tools stop earlier, which is not a flaw if you only want monitoring, but it changes who will use the product daily.
Where dashboards typically fail
- Home screens that are one giant average across engines, countries and prompt types.
- No explanation of how a score is calculated, so nobody trusts it.
- Alerts for every fluctuation. People mute them within a week.
- Reports that need hand-assembly. If the monthly client deck takes two hours of screenshots, the tool is a cost center.
- Per-seat pricing that makes you share logins, so nobody builds habits.
- Slow loading on large prompt sets.
- Data you cannot export or reach by API when you want it in your own BI tool.
UX comparison by tool type
The table below is a rough guide to what each type of tool tends to do well. Check the individual products, since features change fast. Prices are as of the Oct 2026 Fluenta comparison and I did not verify them independently.
| Tool type | Examples | Strong UX points | Common UX weak spots |
|---|---|---|---|
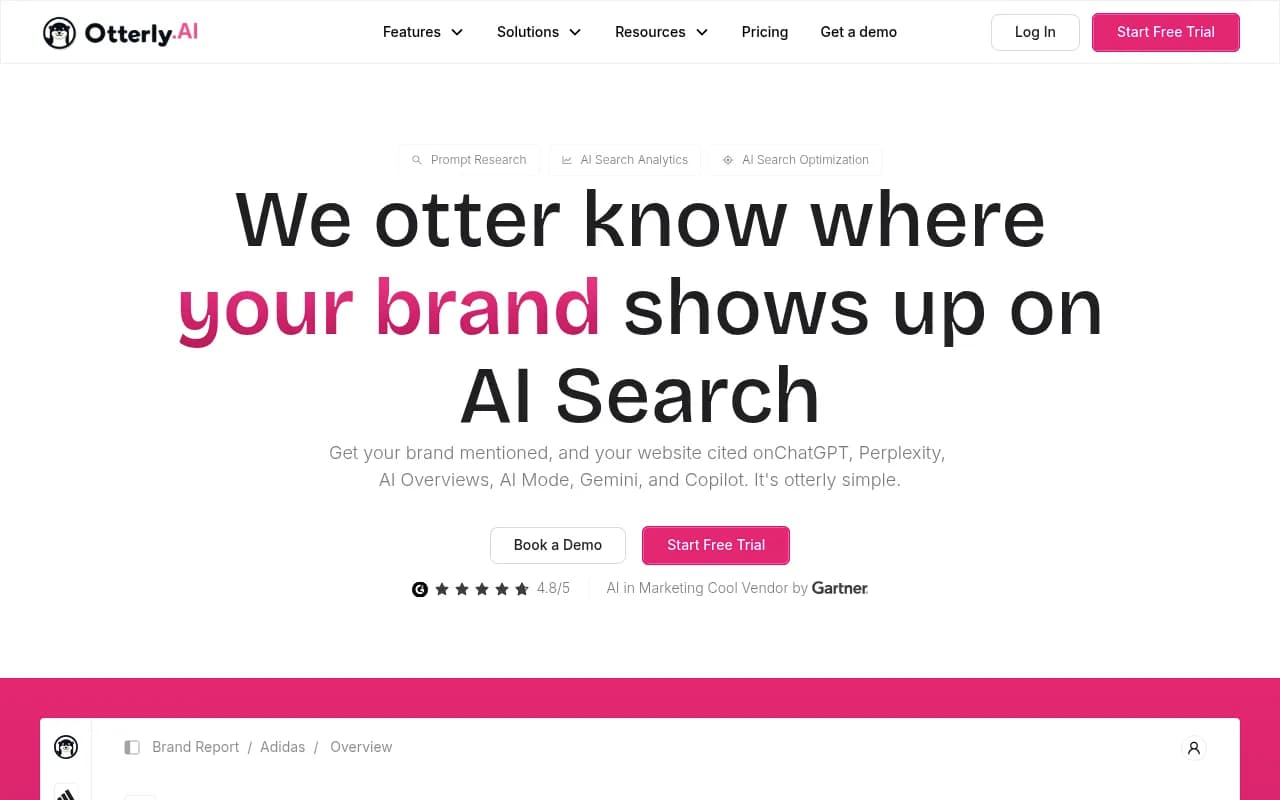
| Lightweight daily trackers | Otterly.AI, Rankscale | Fast setup, simple home screen, low entry price (about $29 and $20) | Light on fixes, limited depth on why |
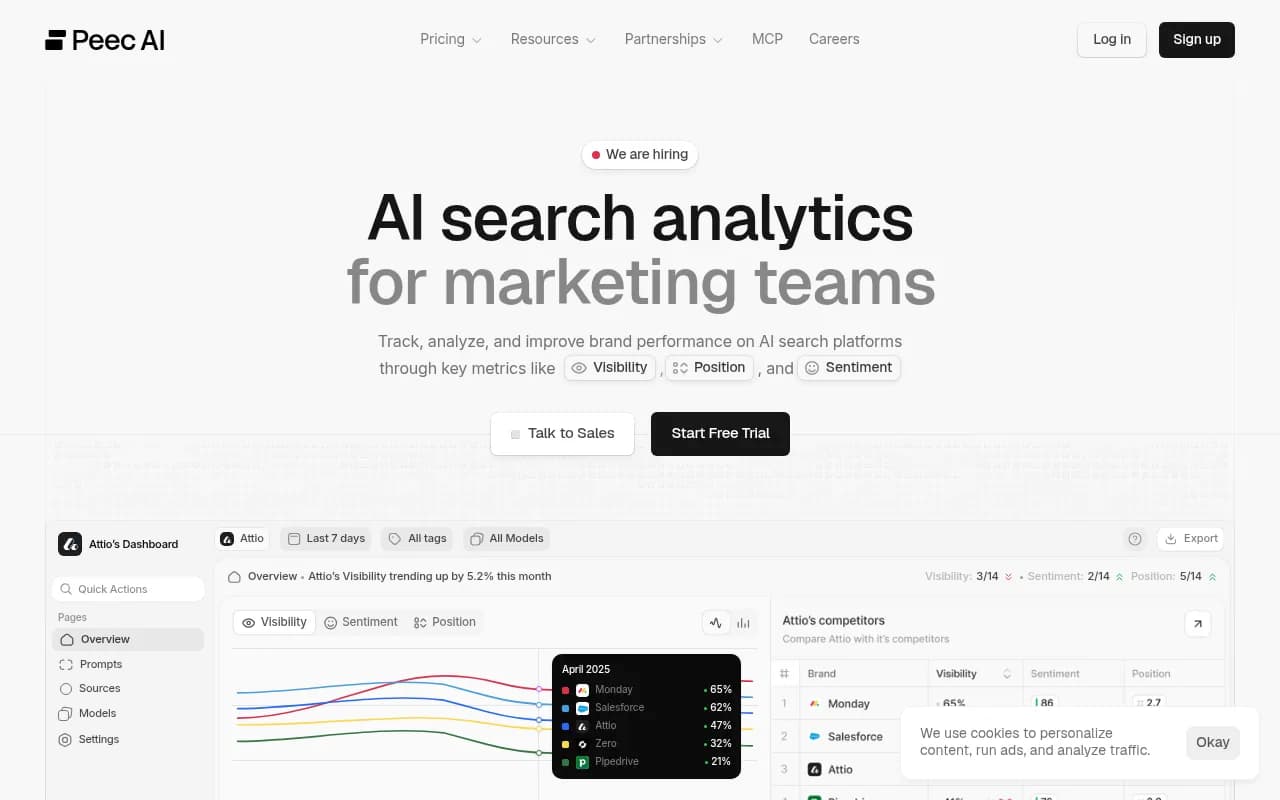
| Mid-market monitors with recommendations | Scrunch AI, AthenaHQ, Peec AI | Action-style suggestions, cleaner reporting | Jumps in price tiers, execution happens elsewhere |
| Enterprise platforms | Profound | Agency workspaces, pitch environments, wide engine coverage | Can be overkill for small teams |
| SEO suites with AI add-ons | Semrush AI Visibility Toolkit, Ahrefs Brand Radar | Familiar interface, one login | AI data often shallower, fixed prompt sets |
| End-to-end optimization platforms | Promptwatch | Crawler logs, traffic, content gaps, Action Board and publishing in one flow | More depth means more to learn up front |

A 10-point trial checklist
Run this during a free trial or demo. Most of it takes under an hour.
- Load 20 of your real prompts. How long does it take, and can you do it in bulk?
- Open the home screen cold. Can you tell in 10 seconds what changed and what to do?
- Pick a drop in a chart. Can the tool tell you whether it was you or the engine?
- Switch engines. Are baselines and sampling visible per engine?
- Click into one lost prompt. Do you see the answer text, cited sources and competitors?
- Find a recommendation. Is there evidence behind it?
- Assign a task to a teammate. Can they act without a login lesson?
- Build the report you send every month. How many minutes?
- Export raw data or hit the API.
- Ask the pricing question: what happens to cost when you add prompts, seats or countries?
Match the UX to the team
A solo marketer does not need agency workspaces. An agency does not want a tool where every client lives in one view. Think about who opens the product on a Tuesday morning:
- Solo marketers and small teams usually want a quick pulse and a short to-do list. Lighter trackers like Otterly.AI or Rankscale fit this, with the caveat that you do the fixing yourself.
- Agencies need client workspaces, white-label exports and pitch audits. Profound and Promptwatch's agency plans both target this.
- Content teams want gaps tied to briefs and a place to publish. This is where action-oriented platforms earn their keep.
- Enterprise teams care about roles, audit logs, SSO and security reviews, so check certifications such as ISO/IEC 27001.
If you are hiring outside help instead of buying software, an agency like 1001 SEO Media can run the tooling for you, though you should still insist on seeing the dashboards and reporting yourself.
For wider shopping, the GEO software directory at bestgeosoftware.com lists many more options, and ai-rank-tools.com focuses on trackers.
What I would pick, and why
If you only want a scoreboard, a cheap tracker is fine, and the best UX there is whichever one you will actually check. If you want visibility to turn into traffic and published pages, choose the tool where insight, task and result live in the same product. That is the argument for platforms like Promptwatch, which pairs prompt tracking with crawler logs, visitor analytics, an Action Board and CMS publishing. Whatever you choose, confirm current plans at the vendor's pricing page, since I did not verify the figures quoted from third-party comparisons.
The simple test is this: three weeks after buying, do you still have a reason to open it on Monday? If the answer is a task waiting for you, the UX is doing its job. If it is a chart you already understood, you have bought a screenshot generator.