Key takeaways
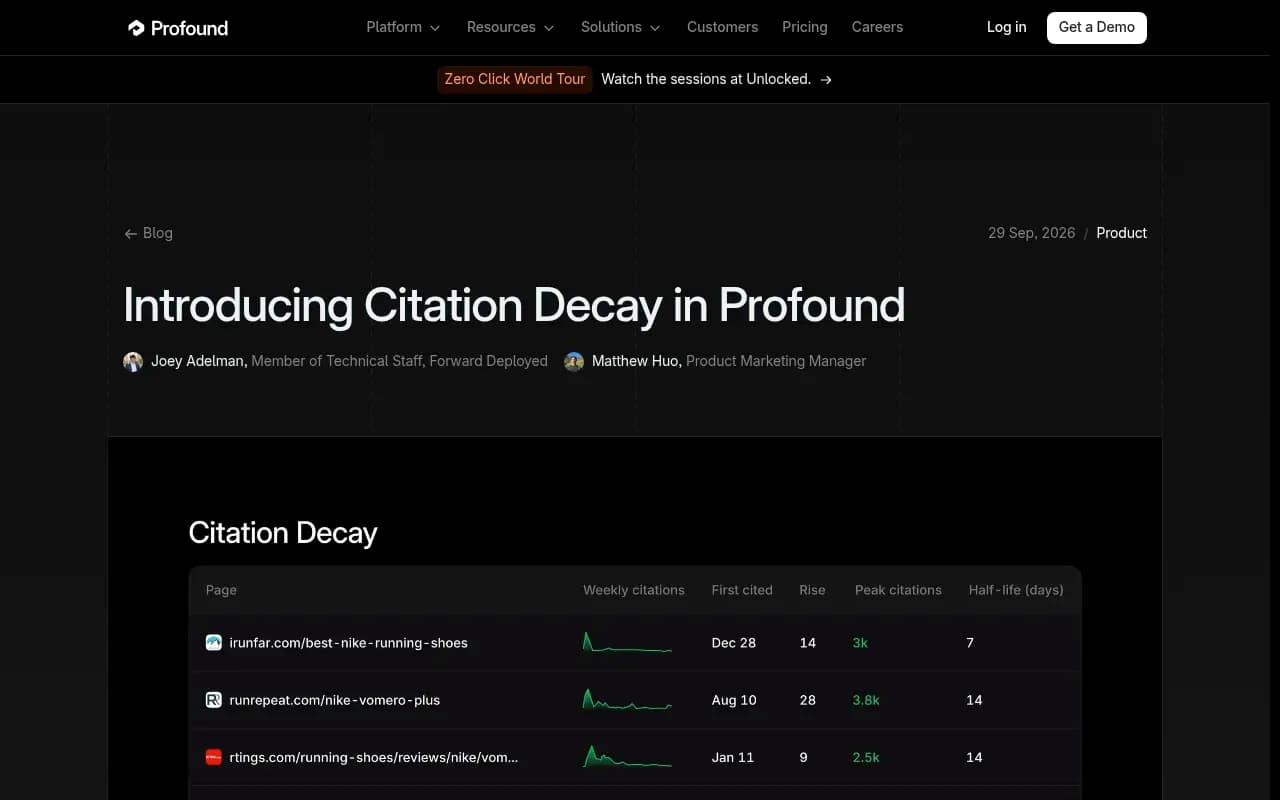
- A page's AI citation life has four readable markers: first cited date, ramp-up (days from first cite to peak), peak, and decay half-life (days from peak until share falls to half and stays there).
- Benchmarks are not interchangeable. Profound's 11-day median measures page share from peak. Scrunch and Stacker's 4.5 weeks measures a weekly source cohort. Promptwatch's content half-life report measures how many day-0 pages are still cited later.
- Most short half-lives are bursts, not losses. Judge a page only after it clears minimum-citation thresholds, and compare it with similar pages before calling it decay.
- Content type changes the curve. In Promptwatch Data, landing pages and docs stay cited longest, while news lost half its pages within 36 days.
- Use the curve to prioritize refreshes, not to publish on a fixed fortnightly schedule.
Why citation curves matter
SEO taught most of us to think of a ranking as something you win and then hold. AI citations do not behave that way. A page can be cited by several engines this week and barely appear next month, while its Google traffic stays flat. The LLMO Framework research page puts it well: a citation is a flow, not a stock.
That changes what you measure. A single "were we cited?" snapshot tells you very little. What helps is the shape of the curve over time for each URL: when it first showed up, how quickly it climbed, where it topped out, and how fast it faded. Promptwatch classifies every citation by content type and source type in its Citation Trends reporting, and tracks first cited date, ramp-up, peak and decay half-life per cited page. This guide explains how to read those four markers, and where they mislead you.

The four markers, defined
The definitions below follow the metric as Profound published it on September 29, 2026, since that is the most explicit public specification. Other platforms use similar ideas with their own details, so check each tool's documentation.
First cited date
The first day any AI engine cited the page. It is your anchor. Everything else is measured from here. It also answers a practical question: how long did it take a newly published page to enter AI answers at all? If you publish through a CMS and track the live URL, you can compare the publish date with the first cited date and see your indexing-to-citation lag.
Ramp-up (rise)
The number of days between the first cited date and the peak date. A short ramp means the page caught on fast. A long ramp means citations built slowly, which usually means engines kept coming back to it.
In Profound's 2026 study of 1.19 million page and engine lifecycles, burst pages had a median rise of roughly 20 days. Sustained pages took 36 to 46 days to reach peak. Pages cited by five or more engines had a median rise of 46 days, against 19 days for single-engine pages.
Peak
The highest point of the page's smoothed citation share. The peak date is the first day it got there. Citation share is the page's citations divided by all citations in the set being measured that day, and it is normally smoothed with a rolling two-week average because daily numbers are noisy.
Decay half-life
The days from the peak until the smoothed share drops to half the peak and stays there. Profound requires it to hold at or below that line for 14 consecutive days through to today. If it bounces back above, the page has not decayed yet. A page that never crosses is simply still holding.
Read ramp-up and half-life together. A page that rose for 45 days and then had a 10-day half-life climbed steadily and then lost relevance fast. A page with a 5-day ramp and a 60-day half-life was a quick hit that stuck.
What the benchmarks actually say
Three public studies get quoted constantly, and they are easy to misuse.
| Study | What it measures | Headline number | Period |
|---|---|---|---|
| Profound (Davis McCain) | Page citation share from its peak, seven engines | Median half-life of 11 days; 78% of pairings fall to half within two weeks; the other 22% have a median of 27 to 29 days | Sep 2025 to Sep 2026 |
| Scrunch and Stacker | Persistence of a weekly source cohort, 3.5M citation events | About 4.5 weeks on average; 3.4 weeks ChatGPT, 5.8 weeks Perplexity | Sep 2025 to Mar 2026 |
| Trakkr | URL-level survival, 108,650 URLs | 73.5% of URLs appear once and never return; 23% still cited after two weeks | Jun 2025 to Mar 2026 |
| Promptwatch Data | Share of day-0 cited pages still cited later, ChatGPT only | News crosses 50% at 36 days; product pages, reviews and how-tos at 74 to 77 days | Jul 6 to Oct 4, 2026 |
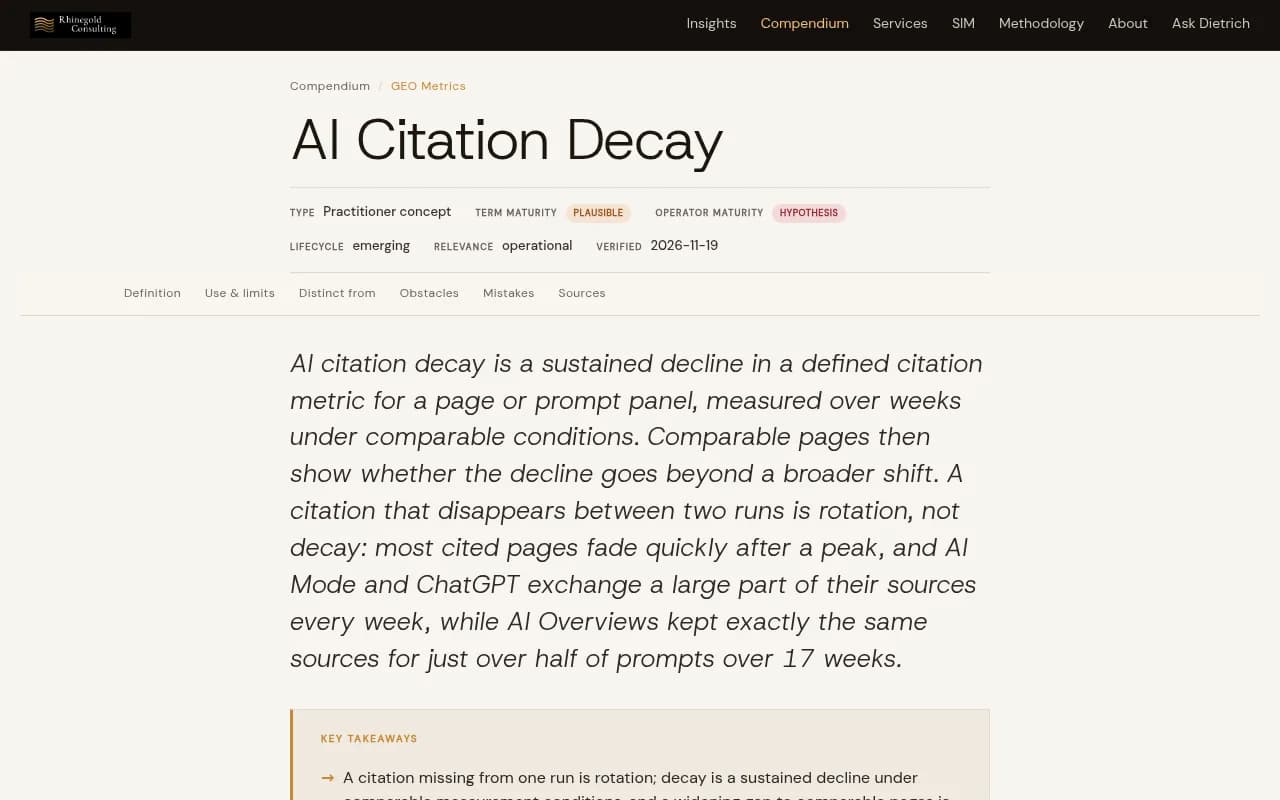
Do not put these numbers side by side as if they were the same thing. The Rhinegold compendium makes this point sharply: Profound's 11 days is share from peak, while the 4.5 weeks is cohort persistence. Promptwatch's report is a survival measure too: it asks whether pages cited on day 0 were cited again, rather than how a page's share declined from its own peak.
Most fast fades are bursts, not decay
This is the biggest trap. Profound found that 78% of page and engine pairings had a half-life of 14 days or less. Because the share is averaged over a rolling two-week window, a page cited once holds its smoothed share up for about two weeks and then drops. Two weeks is effectively the ceiling for a one-burst page, and most land at or just under it.
So a 12-day half-life on its own is not a problem to fix. It is ordinary rotation. Rhinegold's critique is that an alert firing on every fall from peak will fire on most cited pages, and your team ends up refreshing content that never held a stable position. Trakkr's data points the same way: median URL lifespan in its sample was zero days.
The sustained group is where the useful signal lives. Those pages are cited again after the burst, with a median half-life of 27 to 29 days, depending on the engine. Your goal is to get more pages into that group, then read their curves.
Quality gates before you trust a curve
Profound only scores a page when four conditions hold: it has been live and citable for at least 28 days, it has at least 5 citations in total, it reached a peak share above zero, and the peak 14-day window contains at least 5 raw citations. Apply the same logic to any tool, including spreadsheets built from exports.
- Skip pages younger than about four weeks. Their curve is still forming.
- Skip pages with a handful of citations. A low-volume page looks like it decays when it has simply rotated out.
- Check that the peak is real. A peak built from one or two raw citations is noise with a date on it.
- Look at the window end. Pages that peaked less than 14 days ago cannot show decay yet. Promptwatch's own report notes that lines drop faster in the final week because the window closes (right-censoring), so late-window drops are partly an artifact.
Compare with similar pages before calling it decay
Rhinegold's method is worth borrowing. Count citations per page, or per fixed prompt panel, in weekly windows. Compare the trend with a set of comparable pages chosen before the series starts: same page type, similar topic, similar starting level, same platform.
If the comparison pages fall too, you are looking at a platform-wide shift. Models change, freshness signals change, and Microsoft notes that citation patterns can move with partner refresh cycles. If only your page falls, investigate. It may be a competitor's new page, a change to your own page, or a real loss of standing.
Rhinegold flags a check signal only when the gap widens beyond a noise band in three consecutive windows. It describes three windows as a working choice that has not been calibrated, which is honest. Treat it as a heuristic and tune it on your own data.
One more limit: citation data shows that a page lost standing, not why. Page-level URL churn is high. SISTRIX measured 85% weekly drift at URL level and says a single URL's position in AI answers is not a meaningful metric. So read pages in groups, by topic or content type, and look for repeated runs per window.
Read curves by engine
Engines do not move together. In Profound's data, cross-engine correlation of when a page decays was only 0.03 to 0.09, and a sustained Claude citation was 2.8 times as likely as a ChatGPT one to still carry half its peak share eight weeks later. Perplexity and Claude return to a page repeatedly, so citations spread across weeks. ChatGPT, Google AI Mode and Gemini tend to cite a page intensively for a few days and stop.
Practical consequences:
- Never pool engines into one series. A shift in platform mix can create or hide a decline.
- Filter by model before diagnosing. A page that decayed only in ChatGPT is a different problem from one that faded everywhere.
- Pages cited by five or more engines were 5.5 times as likely as single-engine pages to be above half their peak after eight weeks. Breadth is a good sign.
Read curves by content type
Promptwatch Data's ChatGPT content half-life report followed every classified page ChatGPT cited on July 6, 2026 for 90 days.
| Content type | Still cited at 30 days | Still cited at 60 days | Notes |
|---|---|---|---|
| Landing pages | 78% | 69% | Half-life likely close to or beyond 90 days |
| Docs | 76% | 67% | 93% cited again after day 0 |
| Comparisons | 72% | 63% | Long-lived |
| Listicles | n/a | 60% | Worth sustained effort |
| Product pages, reviews, how-tos | n/a | about 55% | Half-life reached at 74 to 77 days |
| News | n/a | 41% | Half gone after 36 days; almost a quarter never cited again |
Profound's own split by purpose tells a similar story with smaller gaps. Pages that help people choose (comparisons, listicles, reviews) had a 29-day median half-life, explain and sell pages 28 days, and report pages (news, announcements, research) 27 days, with report pages also holding least at day 56.
Share is only half the picture. According to Promptwatch's citation share by content type data for September 28 to October 4, 2026, product pages earned 22.4% of ChatGPT citations, landing pages 16.8% and listicles 13.6%, with news at 5.7%. Put share and half-life together and you can decide where effort pays back: news earns citations quickly and loses them quickly, landing pages earn steadily and keep them.
A practical routine for your own pages
Step 1: Build the page list
Export your cited URLs with first cited date, peak date, peak share and current share. Remove pages that fail the quality gates above.
Step 2: Label each page
- Burst: cited briefly, half-life under about 14 days, never recovered. Leave alone unless it matters commercially.
- Sustained and holding: still above half peak. Protect it, and do not touch what works without a reason.
- Sustained and falling: past peak, share heading toward half. This is the refresh queue.
- Slow ramp: long rise, still climbing. Give it time and build internal links to it.
Step 3: Check against comparables
For every page in the refresh queue, compare it with similar pages in the same topic and engine. If they fell too, log it as a platform shift and wait. If only your page fell, move it up.
Step 4: Work out the cause
Check whether AI crawlers can still reach the page, whether a competitor now has a stronger version, and whether facts like prices or specs are stale. Crawler logs help here, because they separate an access problem from a content problem. Promptwatch's AI crawler logs show which bots fetched a page and the crawl-to-citation path.
Step 5: Refresh, then measure again
Update the page, republish, and watch the next two to four weeks of the curve. A refresh should show up as a new rise, not just a slower fall. If nothing changes, the cause was probably outside the page.
Do not over-read the 11-day number
Stratozphere's write-up of the 11-day finding says it calls for careful monitoring, not an automatic fortnightly publishing schedule, and I agree. Eleven days is a median driven by a huge population of one-burst pages. It does not mean every page of yours has an 11-day shelf life. Your landing pages and docs likely behave very differently from your news posts, and Promptwatch Data suggests treating landing pages, docs and pricing pages as long-term citation assets, while using news and press for short bursts.
There is also an open question nobody has settled: whether citation decay shows up before clicks or rankings move. Rhinegold calls it a working hypothesis with no published test, and Similarweb asserts it without click data. Test it on your own pages by comparing when the citation trend turns with when the click trend turns.
Tools that report citation curves
Several platforms now surface some form of citation lifecycle or trend data. Pick based on whether you need the curve itself or the whole loop from diagnosis to fix.
| Tool | Citation lifecycle angle | Best for |
|---|---|---|
| Promptwatch | Citation Trends with 22 content types and 20 source types, first cited date, ramp-up, peak and half-life per page, plus crawler logs and content tools | Teams that want to act on the curve and check the result |
| Profound | Citation Decay view with first cited, rise, peak and half-life, filterable by owned domains and by model | Enterprise monitoring teams |
| Trakkr | Published URL-level survival research, plus AI visibility reporting | Teams wanting benchmarks and revenue tracing |
| Similarweb AI Brand Visibility | Domain Influence Score used to read decay as a multi-window trend | Teams already in the Similarweb suite |

Similarweb AI Brand Visibility
Profound's metric is well specified and its public research is the best data set around, though it is a monitoring product and the work of refreshing is yours. Promptwatch's advantage is that the same product holds the citation curve, the crawler logs that explain access problems, the Content Refresh and Content Agent tools that fix pages, and visitor analytics that show whether refreshed pages send traffic. For a wider list, the GEO software directory at bestgeosoftware.com compares more options.
If you want to see where your own pages stand first, Promptwatch has a free AI visibility report and a 7-day trial on monthly plans. For the plain-language definitions of the underlying metrics, the Promptwatch Academy covers citations versus mentions and how data is collected.
Common mistakes
- Calling a citation missing from one run decay. A single run cannot separate decay from rotation.
- Comparing half-lives across vendors without checking the unit.
- Fitting climb and decay together. Fit the decay from the peak, not from week one, or you will overstate how long pages last.
- Refreshing the oldest pages instead of the ones falling fastest. Age alone is a poor trigger; Profound's point that half of cited content is under 13 weeks old is a reason to monitor, not to rewrite everything.
- Ignoring content type. A news post and a landing page should not share a refresh cadence.
Bottom line
First cited date tells you how fast a page entered AI answers. Ramp-up tells you whether engines kept returning. Peak sets the reference line. Half-life tells you when the page started losing it. Read them per engine and per content type, apply minimum-citation gates, and compare with similar pages before you act. Then spend your refresh time on sustained pages that are really falling, and let the burst pages rotate out.