Key takeaways
- A mention (your brand is named), a citation (your URL is linked) and a position (where you appear in the answer) are separate states. They move independently, so never merge them into one score.
- AI visibility is a sampled distribution, not a rank. One check of one prompt tells you close to nothing. Use a fixed prompt set, repeated runs and a stated denominator.
- Report every metric per engine. A blended number hides the fact that you can lead on one assistant and be absent from another.
- When a metric moves, check whether you changed, the model changed, or the tracker changed before you celebrate or panic.
- Pick a metric for the question you are asking: mentions for awareness, citations for what to fix, position for how you are framed, and referral traffic for business impact.
Why AI rank tracker numbers are so easy to misread
Classic rank tracking gave us a comfortable mental model. You have a keyword, a results page, and a number between 1 and 100. If the number goes down, you won.
AI answers do not work like that. An assistant returns one synthesized answer, which may name three brands and cite six sources. Ask the same question twice and you can get different brand lists, different orderings and different sources. That makes every AI visibility number a probability, not a position you can look up.
The sampling problem is bigger than most dashboards admit. The Obsurfable write-up on measuring AI visibility without fooling yourself pulls together several findings:
- Trakkr Research found 73.5% of citation URLs appeared exactly once across 10 months of daily tracking on 8 models.
- A September 2026 study of 50 questions, six engines and 15 repeated runs found that a single run captured only 62% to 77% of the brands seen across five runs.
- An audit of four live engines on 15 matched prompts found 96.4% of URLs appeared in only one engine.
I have not verified those studies independently, but they all point the same direction, and it matches what you see in any real tracking project: volatility is a property of the system, not noise to smooth away.
So before comparing any two numbers, ask what the denominator is. Percent of what? Which prompts, how many runs, which engine, which country? A tracker that cannot answer those questions is giving you a feeling, not a measurement.
The three states: mentioned, cited, recommended
Most confusion comes from treating these as one thing. They are not.
- Mentioned: the answer names your brand. No link required.
- Cited: the answer links one of your URLs as a source. Your name may never appear in the text.
- Recommended: the answer suggests your brand as an option to choose.
VizibAI puts it neatly: a brand can be recommended without a single link, or cited without being named. Count only one state and you get a distorted picture.
What a mention tells you
A mention rate answers one question: are we in the answer at all? It is the share of tracked prompts where an engine names your brand. It is a fine awareness metric and a poor action metric, because it does not tell you why you were named.
A mention can come straight from the model's training data. The assistant knows your brand and says so, with no retrieval at all. That is useful, but you cannot fix it with a page edit tomorrow.
What a citation tells you
A citation means the engine read a page and used it. Citation rate is usually defined as answers citing at least one of your URLs divided by answers tracked. If your domain shows up in 18 of 200 answers, your rate is 9%.
Citation share is a related but different number: of all the sources linked in an answer, how many are yours. Citation rate asks whether you appear at all; citation share asks how much of the source list you own.
This is the most actionable metric of the group, because it points at pages. If one comparison site keeps feeding answers in your category, getting listed or improved there changes what the AI says.
What a recommendation tells you
Recommendation is the quality layer. Being listed among ten brands is not the same as being the one the assistant tells the buyer to pick. The gap between your visibility rate and your recommendation rate is, in VizibAI's framing, your quality gap. I think that is the single most underused comparison in AI reporting.
Where position fits, and where it misleads
Position is the order in which your brand appears when it is named. Some trackers report the share of answers where you are named first. Others report an average position, where lower is better.
People fight about this metric. One camp says to ignore it. The Citation Lab argues that a positive mention without a link has the same commercial value as no mention, because the buyer never reaches your site, so position is a reputation metric, not an optimization one. The other camp says prominence matters a lot, and that if you are the fifth brand in a list of eight, you are effectively invisible.
I sit between them. Position is real information, but only when you read it correctly:
- It exists only when you are mentioned. Average position is calculated on a subset, so a brand mentioned in 5% of answers can have a beautiful average position that means very little.
- It is unstable. Orderings change from run to run, so a single position is closer to a coin flip than a rank. Average it over many runs.
- It depends on prompt type. A comparison prompt naming three brands has a different position game than an open organic prompt.
Promptwatch's own data on ChatGPT shows why position and framing deserve attention. In Promptwatch Data's report on unique domains per ChatGPT response (Sep 28 to Oct 4, 2026), 47.6% of cited responses cite 10 or more unique domains. For organic prompts, 52.5% do. When that many sources share an answer, a citation alone is a weak signal. Where you appear and how you are described count for more.
A quick map of each metric
| Metric | What it counts | Good for | Blind spot |
|---|---|---|---|
| Mention rate | Share of prompts naming your brand | Awareness, share of voice | Says nothing about links or traffic |
| Citation rate | Share of answers linking at least one of your URLs | Finding pages and sources to fix | A crowded answer can cite you without choosing you |
| Citation share | Your slice of all sources cited | Competitive source coverage | Sensitive to how many sources an answer lists |
| Average position | Order of brands when named | Prominence, framing | Only calculated when you are mentioned |
| Recommendation rate | Share of answers suggesting you as an option | Quality of visibility | Depends on how the tracker classifies recommendations |
| Sentiment | Tone of how you are described | Reputation | Does not show whether you are visible |
| AI referral sessions | Visits arriving from assistants | Business impact | Undercounts; tracking breaks |
How the metrics disagree, and what each mismatch means
The useful trick is to read mention rate and citation metrics together. ASVA's guidance is to read mention rate first, then citation share, because a change in one usually explains the other.
- Mentions steady, citations falling. A source you relied on is gone. It may have been removed, blocked to a retrieval crawler, or outranked by a newer page.
- Mentions falling, citations steady. The framing changed. The engine may now answer with a competitor in the slot you used to hold.
- High mentions, low citations. The model knows you from training data but cannot find or use your content at retrieval time. The Citation Lab calls that a content architecture problem, not a brand awareness problem, and reports gaps between 8 and 39 percentage points in its audits.
- High citations, low mentions. Your pages are used as raw material but the answer does not name you. Check how the page presents your brand and whether the claim is attributed.
- Visibility up, traffic flat. Check tracking first. Arcalea documents that between October 8 and October 16, 2026, marketing teams reported 30% to 40% declines in ChatGPT referrals, and Profound traced it to the share of ChatGPT answers with links tagged utm_source=chatgpt.com collapsing. A team reading referral traffic alone could have mistaken a tagging bug for a visibility collapse.
Arcalea groups metrics into three layers: exposure (are you mentioned and cited), behavior (branded search and on-site actions) and outcome (pipeline and revenue). When the layers disagree, rule out tracking breaks and allow for lag before reading meaning into the mismatch.
Five ways trackers fool you
1. One run, one answer
The fastest way to fool yourself is to check a prompt once. The research above suggests a single run can miss a quarter or more of the brands that would show up across repeated runs. Any tracker that reports on a single sample per prompt is underselling the noise.
For ongoing monitoring, think in terms of probability. A move from 22% to 24% across a modest prompt set is not a trend. The Citation Lab observed provider citation rates shifting by 4 points and mention rates swinging by 7 to 8 points in both directions between otherwise identical runs. That is your noise floor to beat.
2. Changing the prompt panel
Change the prompts and you have changed the denominator. You cannot compare this month to last month if you swapped half the panel. LLM Pulse's method recommends a fixed library of roughly 20 to 50 prompts built from real buyer language, run on a schedule. Keep brand-name prompts separate from category prompts, since prompts that include your name inflate your mention rate by construction.
3. Blending engines
A blended score across ChatGPT, Gemini, Perplexity and AI Overviews is nearly useless for decisions. You might be at 30% on Perplexity and 0% on ChatGPT, which changes your strategy completely. The same Citation Lab write-up makes the case for per-provider reporting, and the finding that 96.4% of URLs appeared in only one engine in one audit makes it hard to argue.
4. Ignoring that the model changed
Sometimes the movement is not yours. Promptwatch Data's citation drop report shows average citations per response fell across GPT-5.3, GPT-5.4 and GPT-5-Mini around the GPT-5.3 rollout on March 4, 2026. A drop in your citation count that week says nothing about your content.
Other platform shifts are just as abrupt. Promptwatch Data found reddit.com's share of ChatGPT citations fell from about 4% to 0.5% on August 14, 2026, and ChatGPT began using the site: operator at scale on August 8, 2026, taking it from about 0.4% to about 17% of fanout queries. Annotate your charts with these events, or you will invent explanations.
5. Assuming your tracked prompt is the real query
Tracker prompts are an approximation. The engine often rewrites your question into its own searches. Promptwatch's query fanout data shows average query length falling from about 117 characters in early December to about 53 from April. Your page has to match a query the model generates, not the prompt the buyer typed. That is one reason a tracked prompt can show no citation while a closely related page quietly earns them.
Also remember that citations decay. In Promptwatch Data's content half-life report, news pages lost half their cited pages within 36 days, while landing pages and docs stayed cited longest. A citation you earned last quarter is not an asset you own.
Which metric for which question
| If you want to know | Lead with | Cross-check with |
|---|---|---|
| Are we part of the conversation? | Mention rate per engine | Share of voice against competitors |
| What should we fix this month? | Citation rate and cited sources | Which domains feed answers on your topics |
| Are we chosen, not just listed? | Recommendation rate | Average position, sentiment |
| How are we described? | Sentiment and accuracy of claims | Brand-level claim analysis |
| Does any of this make money? | AI referral sessions and conversions | Branded search volume |
There is no universal benchmark. The Citation Lab suggests above 30% citation rate on at least one provider is a meaningful baseline, but that is one team's rule of thumb. Compare against your own baseline and against the leader in your competitive set.
A minimum viable measurement setup
You do not need a perfect system. You need a consistent one.
- Build a panel of 20 to 50 prompts from real customer language. Tag each as organic, brand-specific or competitor comparison.
- Run the panel on a fixed schedule, with multiple runs per prompt per engine.
- For each response, log the date, engine, prompt, whether you are mentioned, whether you are cited, your position when named, the top cited domains, and the URL cited.
- Report mention rate, citation rate and average position separately for each engine, with the denominator written next to every number.
- Annotate model releases, platform changes and your own publishing so you can explain jumps.
- Review weekly for sudden drops and new or lost cited sources. Review monthly for trends.
- Match against your analytics. Remember that referral attribution can break, so treat traffic as a cross-check, not the only truth.
That last point deserves emphasis. Visibility metrics describe exposure. They do not prove revenue. Use them to decide where to work, and use analytics to confirm whether the work paid off.
Choosing a tracker that makes these distinctions
What matters is not the logo but whether the tool lets you separate the three states, see the denominator, and break results out by engine, country and prompt type. Questions worth asking any vendor:
- Does it capture the real interface of each assistant, or only API output? User-facing answers and citations can differ from API responses.
- How many runs per prompt, and can you change the frequency?
- Does it show which sources were cited, not just whether you were?
- Can you see sentiment and the specific claims being made about you?
- Does it connect to crawler or traffic data so you can tell an access problem from a content problem?
Promptwatch covers that ground. It tracks prompts across ChatGPT, Gemini, Perplexity, Google AI Overviews and others from the real interfaces, reports Visibility Score, Share of Voice, position and sentiment as separate metrics, and adds citation rank and self-citation rate so you can tell a coverage problem from a prominence problem or a crawlability problem. Its IP-verified crawler logs and visitor analytics help separate a tracking break from a real visibility change. The Promptwatch Academy explains each metric if you want the definitions before you commit.
Other trackers worth a look, depending on budget and team size:


Seo suites that bolted on AI tracking, such as [tool:semrush-ai-visibility-toolkit] and [tool:ahrefs-brand-radar], are easy to start with if you already pay for them, though check how many prompts they let you fix and repeat. For a wider scan of the market, the GEO software directory at bestgeosoftware.com lists more options.
| Tool | Strength to check | Question to ask before buying |
|---|---|---|
| Promptwatch | Metrics separated, plus crawler logs and traffic | Does the plan cover enough prompts and runs for your panel? |
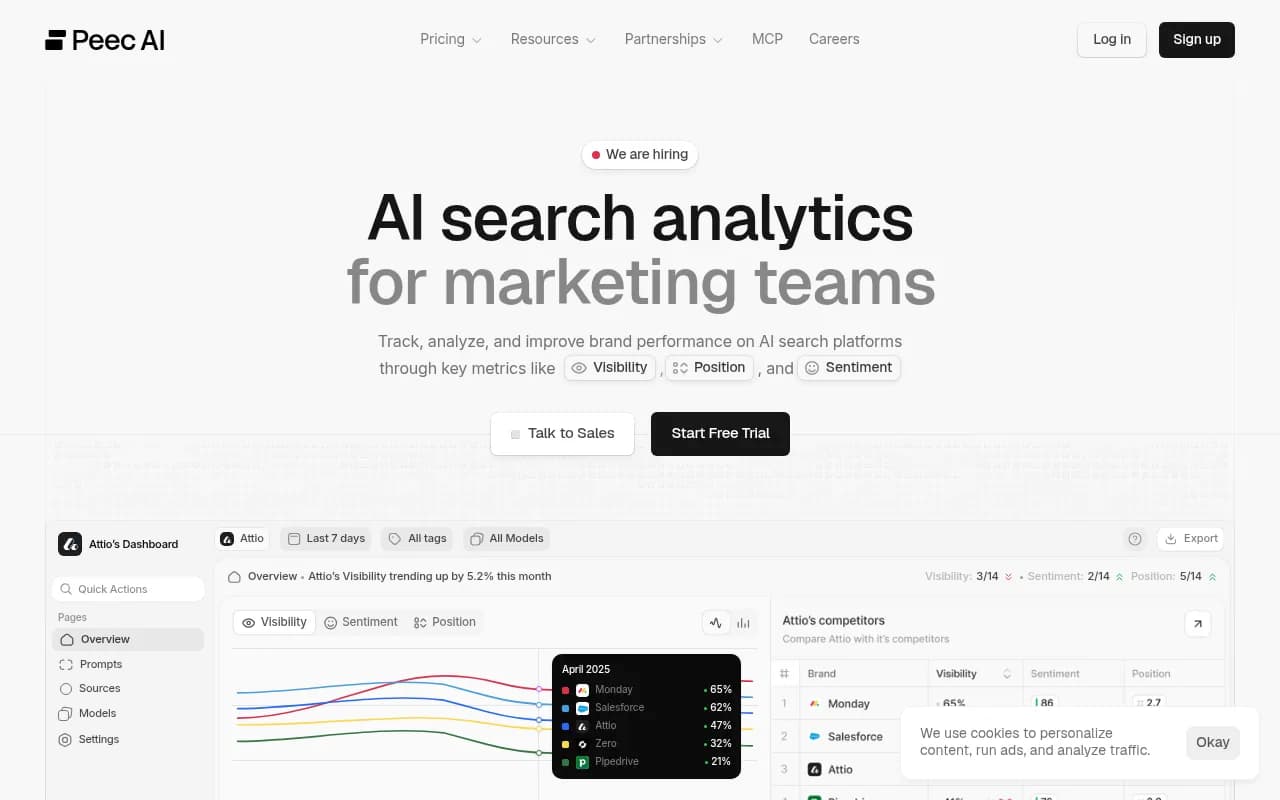
| Peec AI | Simple tracking with suggestions | How does it handle repeated runs? |
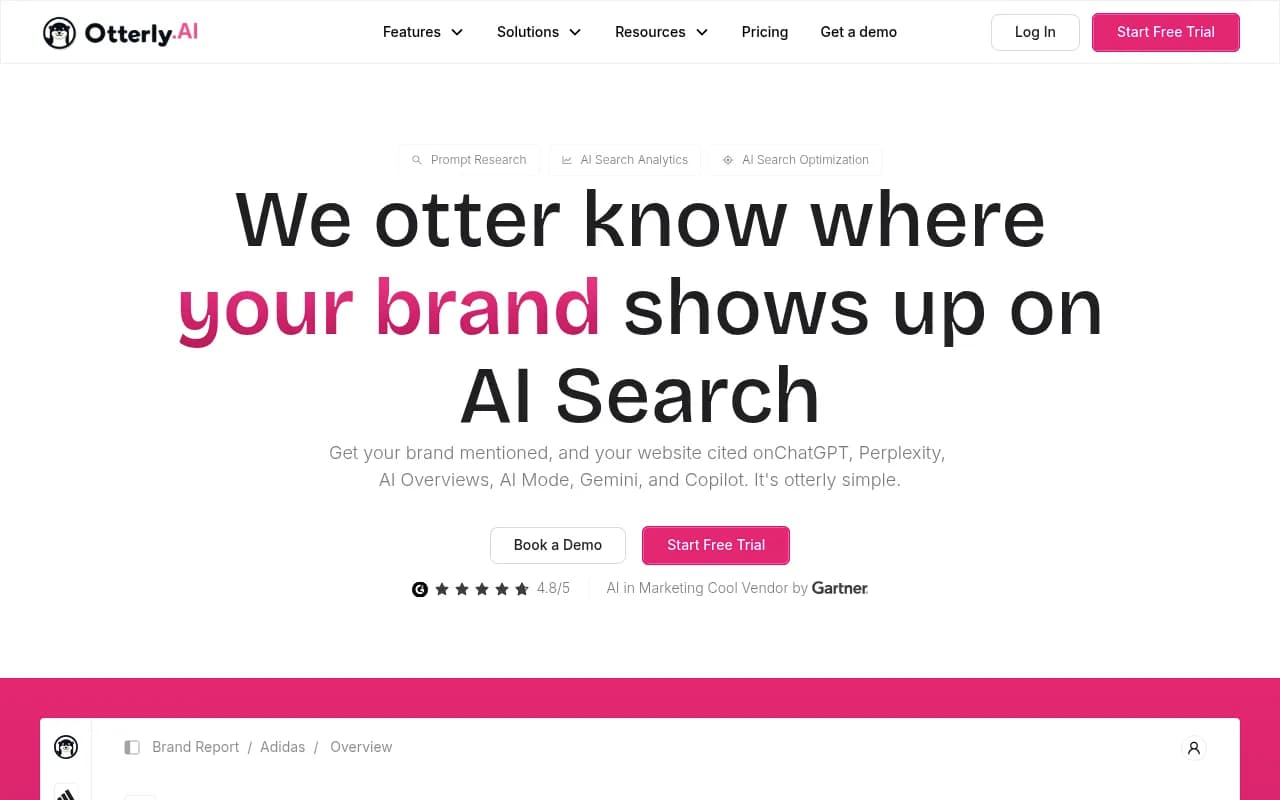
| Otterly.AI | Affordable monitoring | Can you see cited sources per prompt? |
| Profound | Enterprise analytics | Is the price justified by your volume? |
| LLM Pulse | Methodology-led sampling | Does it report denominators clearly? |
Pricing changes often. Confirm current plans on each vendor's site, and for Promptwatch, on promptwatch.com/pricing.
A practical reading routine
Here is the routine I would run every week, in order.
- Check the denominator. Same panel, same run count, same engines as last week?
- Look at mention rate per engine. Anything that moved more than the noise floor?
- Look at citation rate and the list of cited domains. Did a source appear or vanish?
- Compare mentions with citations. Use the mismatch table above to pick a hypothesis.
- Check position and sentiment only for prompts where you are named, and read a few raw responses by hand. Numbers hide tone.
- Check for external events: a model release, a crawler change, a tracking bug.
- Only then write the story. And pick one action.
Most weeks the honest conclusion is that nothing meaningful changed. That is a good outcome, not a failure of the report.
The short version
Mentions tell you whether the assistant knows you. Citations tell you which pages are doing the work. Position and recommendation tell you whether you are chosen. Traffic tells you whether any of it mattered. Keep them apart, report them per engine, write the denominator next to every number, and treat any single-run result as an anecdote. If your tracker cannot do that, the dashboard is flattering you.