Key takeaways
- A CMO report on prompt tracking should fit on one page: a headline, four metrics, a movement summary, risks, and a decision you need.
- Report mentions and citations separately. Assistants name brands more often than they link them, so a citation-only view can make you look invisible when you are not.
- Run each prompt 3-5 times per engine before you trust a number. One run proves nothing.
- Benchmark each engine on its own. ChatGPT averages about 5 citations per web-search answer, Google AI Overviews about 10, so a single blended score hides what is happening.
- Tie at least one metric to revenue (AI referral sessions in GA4), or the report stays a curiosity.
Why prompt tracking reports fail in the CMO's inbox
The usual version looks like this: a spreadsheet with 150 prompts, a green or red cell per engine, and a visibility score that moved from 31 to 34 for reasons nobody can explain. The CMO reads the first three rows, asks "so are we winning?", and the thread dies.
The scenario that triggers most of these reports is simple. Someone senior forwards a ChatGPT screenshot that names three competitors and not you. The Supermetrics guide on measuring AI search visibility opens with exactly that moment, and it is the right framing. Your report exists to answer that screenshot: how often does this happen, on which engines, for which topics, and what are we doing about it.
So write for that reader. They want a verdict, a reason, a risk, and a decision. Everything else goes in an appendix they will never open.
The four metrics worth putting on the page
Supermetrics recommends four metrics, each from a different source. I think that structure is right, because it stops you leaning on one fragile number.
- AI impressions. From Google Search Console (AI Overviews and AI Mode) and Bing Webmaster Tools (Copilot). Google announced its generative AI performance reports in June 2026. They break out by page, country, device and date, but they do not include clicks, CTR or query data. Treat them as exposure, not traffic.
- Citation share. Your citations as a share of all citations across your tracked prompts. Bing added a Citation Share view to Webmaster Tools in June 2026, defined as your citations as a percentage of all citations shown for the same grounding query.
- AI referral sessions. From GA4, where visits from assistants land in the AI Assistant channel of the Default Channel Group. This is the only one of the four that connects to revenue, so it earns the top spot on the page.
- Prompt-level presence rate. The share of tracked prompts where your brand appears at all, as a mention or a citation, across repeated runs.
Why traffic alone is not enough
It is tempting to report only AI referral sessions because the CMO understands sessions. Resist that. Ahrefs analysed December 2025 Search Console data across 300,000 keywords and found an AI Overview correlated with a 58% lower average CTR for the top-ranking page, up from 34.5% in April 2025. Pew Research, looking at March 2025 browsing data from 900 US adults, found people clicked a traditional result 8% of the time when an AI summary appeared, versus 15% without one.
So a user can see your brand in an answer, never click, and still be influenced. Traffic undercounts that. Presence and citation share capture it. You need both views, side by side.
Mentions versus citations: report both
A mention is the assistant naming your brand. A citation is the assistant linking your URL. Assistants name brands more often than they link them. If your report only counts citations, you can show the CMO a flat zero for a prompt where ChatGPT recommends you by name in the first sentence.
The split also tells you what to fix. Mentions without citations usually point to a content or crawlability problem: AI knows you exist but does not treat your pages as the source. Citations without mentions suggest your content is used as background while a competitor gets the recommendation. Put both numbers in the template.
Sampling rules that keep the numbers honest
The same prompt can return different answers on consecutive runs. Supermetrics' rule of thumb is to run each prompt 3-5 times per engine in a logged-out session and report the rate, not the single result. I would add two more habits:
- Fix the prompt set for the quarter. If you change prompts every month, you cannot show a trend. Add new prompts in a separate cohort and say so.
- Keep location and language constant per monitor. Mixing markets in one number makes it meaningless.
If you are still building the set, the AEO prompt research by vertical method from Chatter Buzz Media is a reasonable six-step starting point, with starter prompts for seven verticals.
Benchmark each engine separately
Engines hand out very different numbers of citation slots, and Promptwatch Data's average sources per response report shows it clearly. It is built on more than 26B data points collected from the real interfaces of ChatGPT, Gemini, Perplexity, Claude and AI Overviews. Roughly:
| Engine | Average citations per answer | How to treat it in the report |
|---|---|---|
| ChatGPT | About 5 (web-search answers only) | Drifts with model and retrieval updates, so annotate big changes |
| Google AI Overviews | About 10 | Steady over time, good for trend lines |
| Perplexity | Almost exactly 10 | Very stable, useful as a test bench for your own content changes |
| Copilot | Swung from under 2 to nearly 17 within weeks, then settled low | Judge on monthly trends, never weekly snapshots |
The practical consequence: a drop in an engine's average citations means a smaller citation pool, not necessarily that you lost ground. If you want context on that kind of shift, see Promptwatch's report on the ChatGPT citation drop after GPT-5.3. Cite your share, not the raw count.
The one-page template
Copy this structure. Keep it to one page, whether it is a PDF, a slide, or a Notion doc.
1. Headline (two sentences)
State the verdict and the reason. Example: "AI presence held at 38% of tracked prompts this month, but citation share on ChatGPT fell 4 points after a retrieval change. AI referral sessions grew 12% and now account for X conversions." No adjectives, no hedging.
2. The four-metric strip
One row, four boxes, each with the current value, last month, and the quarter-ago value.
| Metric | Source | This month | Last month | 90 days ago |
|---|---|---|---|---|
| AI impressions | Search Console, Bing Webmaster Tools | |||
| Citation share | Tracking platform, Bing Citation Share | |||
| AI referral sessions | GA4 (AI Assistant channel) | |||
| Prompt presence rate | Tracking platform, 3-5 runs per prompt |
Add a second line under presence rate that splits mentions from citations.
3. Engine breakdown
A small table with presence rate and citation share per engine, plus one comparison against your top two competitors. Note the sampling method in a footnote: runs per prompt, logged-out, country and language.
4. What moved and why
Three bullets at most. Each one names a change (a page published, a competitor launch, an engine update) and its measured effect. If you cannot explain a movement, say "cause not yet identified" rather than inventing a story. CMOs forgive uncertainty far faster than they forgive a wrong explanation.
5. Risks
One or two lines. Examples: a competitor owns a high-volume comparison prompt; an AI crawler is blocked on a key section; a model is repeating an outdated claim about pricing.
6. Decision or ask
The reason the CMO opens this at all. "Approve budget for 8 comparison pages" or "Sign off on updating pricing claims across 5 pages." If there is no decision, say what you are doing next and when you will report on it.
The proposal.biz client-report guide makes a useful point here: follow the rhythm readers expect, headline, numbers, what worked, what did not, what happens next. If you use an LLM to draft the narrative sections, feed it your table and tell it to interpret, not describe.
Where the data comes from
You have three layers to assemble every month: engine-side data (Search Console, Bing), site-side data (GA4), and prompt tracking from a dedicated tool. The first two are free. The third is where tool choice matters, mostly for three reasons: does it collect from real AI interfaces rather than only APIs, can it run prompts repeatedly and schedule PDF exports, and does it connect to traffic.
Promptwatch covers this end to end. It tracks ChatGPT, Gemini, Perplexity, Claude, Google AI Overviews, AI Mode and Copilot from their real interfaces, splits Share of Voice, Position and Sentiment, and can schedule PDF reports of any dashboard to an inbox. Its visitor analytics and crawler logs cover the traffic half. On every plan prompts run daily, and Business adds 12, 6 or 1-hour runs for a steadier number. Check pricing for current tiers.
Other tools in the category worth a look for the reporting layer:
| Tool | Strength for CMO reporting | Watch out for |
|---|---|---|
| Promptwatch | Monitoring, traffic attribution, content actions and scheduled PDFs in one product | Content Agent and faster tracking start on the Business plan |
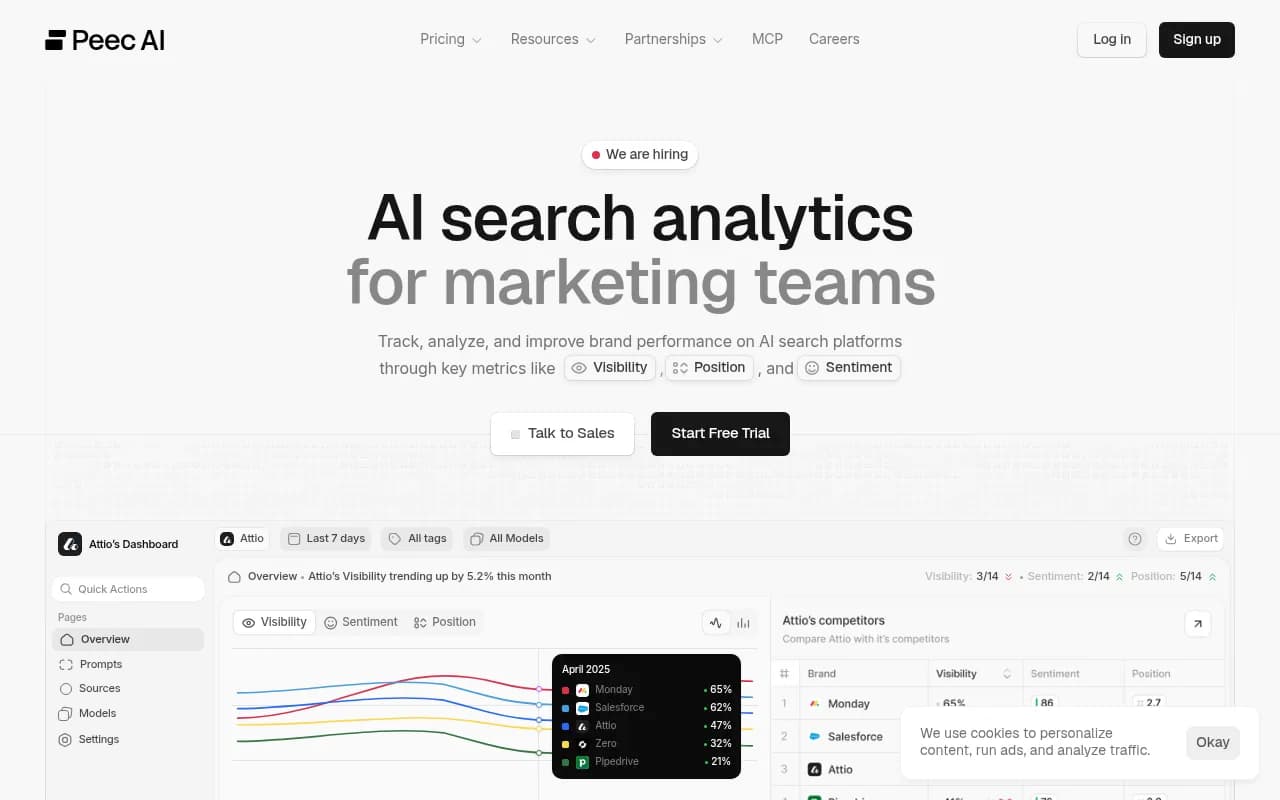
| Peec AI | Clean dashboards, quick to set up | Monitoring focus, thinner on traffic and crawler data |
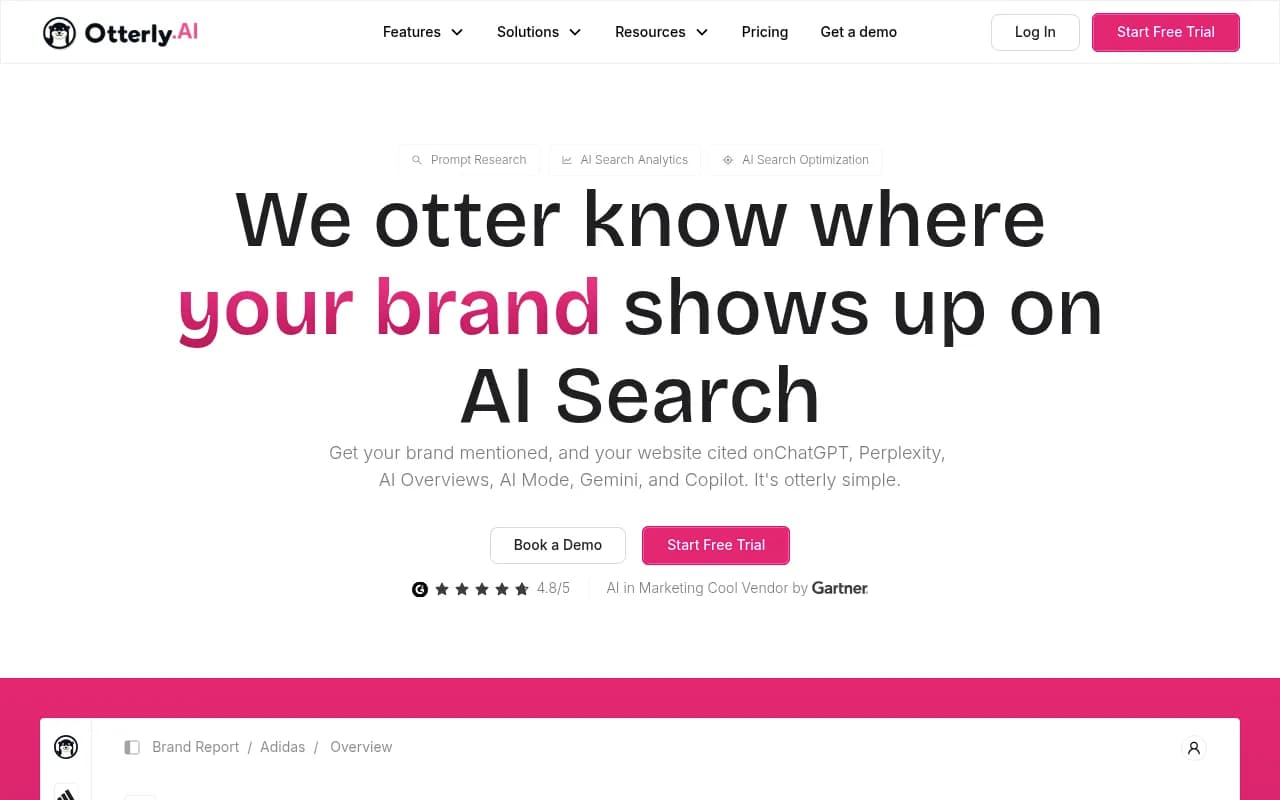
| Otterly.AI | Affordable monitoring | Basic tracker, you assemble the revenue story yourself |
| Profound | Enterprise analytics depth | Higher price point |
| Semrush AI Visibility Toolkit | Sits next to existing SEO reporting | Less AI-specific depth |
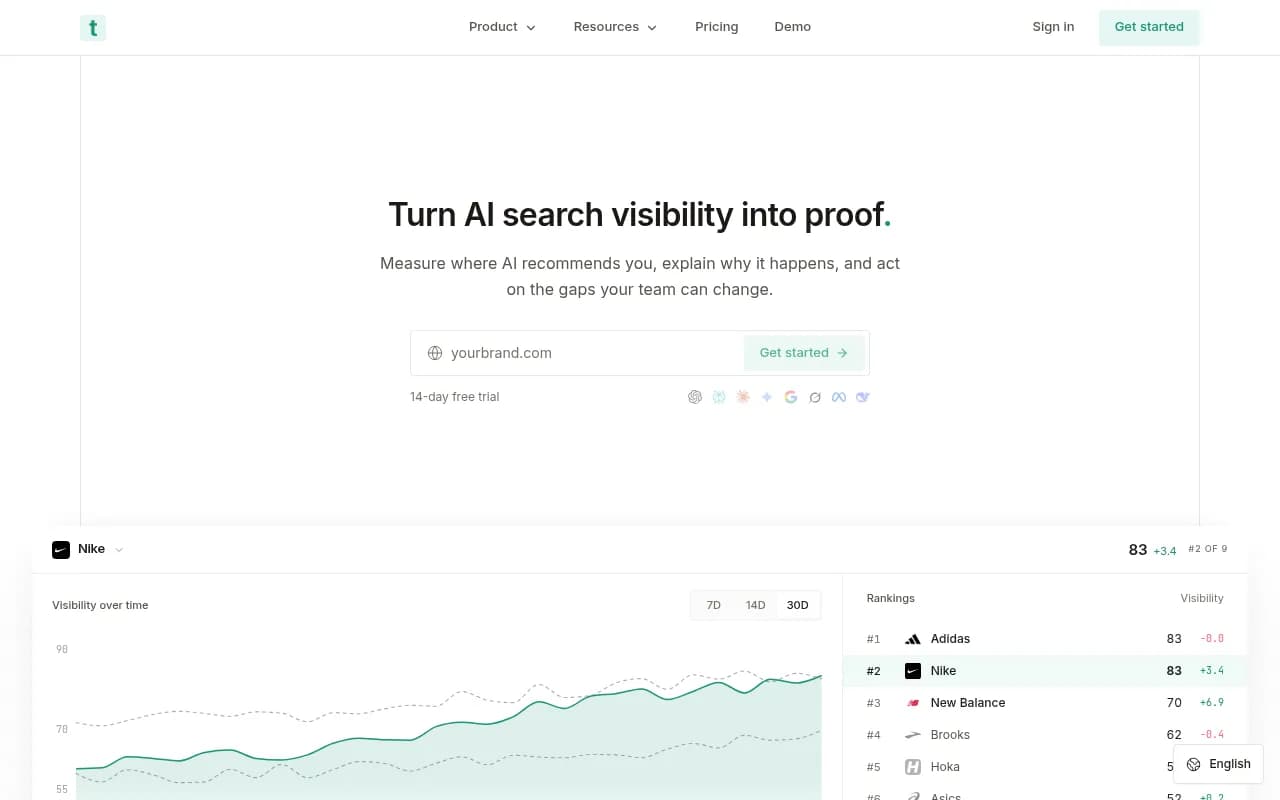
| Trakkr | Traces AI visitors to revenue | Narrower scope on citations |
If you want to compare more options, the GEO software directory lists dozens of them.
For the traffic side, the Promptwatch Academy guide on attributing AI traffic walks through the setup. One caveat worth putting in your footnotes: ChatGPT stopped sending a referrer on October 8, 2026, so untagged visits can land in Direct. Tag your own links with utm_source=chatgpt.com where you can, and say in the report that AI referral sessions are a floor, not a total.
Pitfalls that get reports torn apart
These are the five I see most, and each one has a one-line fix.
- Single-run results. Report a rate from 3-5 runs, never a one-off screenshot.
- Citations only. Add mentions, or you will report an invisibility that is not real.
- Impressions treated as traffic. Search Console AI impressions are exposure. Label them that way and keep them apart from GA4 sessions.
- Weekly Copilot swings. Its average moved from under 2 to nearly 17 sources within weeks. Use monthly trends.
- Falling average citations read as lost share. Check the engine-wide average first. If the pool shrank, your share may be unchanged.
Cadence and format
Combine everything into one report on a fixed monthly refresh. Weekly is too noisy for most engines and trains the CMO to react to variance. A quarterly review is the right place for the bigger story: topic gaps, content you shipped, and whether presence translated into sessions and conversions.
A workable rhythm:
- Monthly: the one-pager, sent on the same day each month.
- Quarterly: the one-pager plus a two-slide appendix on topic gaps and competitor movement.
- Ad hoc: a short note when an engine changes behaviour, with the data attached. A CMO who hears about a model update from you first will trust the monthly numbers more.
A quick pre-send checklist
- Does the headline say what happened and why in two sentences?
- Are mentions and citations shown separately?
- Is every figure backed by 3-5 runs per engine, and is that stated?
- Is each engine benchmarked against its own baseline?
- Is at least one number tied to sessions or conversions?
- Is there exactly one decision or next step at the bottom?
If the answer to all six is yes, the page will survive the meeting. If you are an agency or in-house team that wants a hand with the strategy behind the numbers, 1001 SEO Media builds this kind of reporting into its AI search and GEO work.