Key takeaways
- Manual weekly CSV exports break down fast: filters drift, someone forgets, and the data goes stale the moment it lands in a spreadsheet. The Promptwatch API (v2) lets you pull the same data on a schedule with roughly 70 endpoints covering visibility, citations, sentiment, crawler logs, and competitor analysis.
- API and MCP access is included on every Promptwatch plan, including the free Explore tier. Some competitors gate API access or charge per extra model, which quietly makes automated reporting harder elsewhere.
- The three things that will bite you: organization-level keys need an
X-Project-Idheader on every request, time-series endpoints use cursor pagination, and there are no webhooks. Your job has to poll on a schedule, not wait for a push. - Rate limits are generous for a weekly pull (even the free tier allows 100 requests/hour), but 429 handling is entirely your responsibility. Read the
Retry-Afterheader instead of guessing. - If you don't want to write code at all, Promptwatch's built-in Scheduled Reports email a PDF weekly with zero engineering. The API route wins when you need the data in Slack, a BI tool, or a client dashboard.
Why manual exports stop working after week three
The manual workflow is familiar to anyone doing AI visibility work: open the dashboard Monday morning, apply the same filters as last week, hit Export, paste the CSV into a reporting sheet, re-do the charts, send it to the team. It works once. It works twice. By week four someone's on holiday, the filters don't quite match last week's, and nobody notices that the competitor comparison now excludes one model.
There's a subtler problem too: weekly snapshots are noisy. Promptwatch's data on average sources per response shows that Microsoft Copilot's citation count has swung from under 2 sources per response to nearly 17 within a few weeks. A single week of Copilot data tells you more about Microsoft re-architecting its retrieval pipeline than about anything you did. An automated pipeline fixes this because it stores history consistently, so you can compare week-over-week against a stable baseline instead of eyeballing two differently-filtered spreadsheets.
The good news: Promptwatch exposes all of this programmatically, and API access ships on every plan tier, not just enterprise.
First, decide if you actually need the API
Before writing any code, know what's already built in. Promptwatch has native scheduled reports: open a project dashboard or monitor page, click Export, switch to the Scheduled report tab, and configure a weekly delivery. Reports go out by email at 06:00 UTC on your chosen day, with a lookback window of 7, 14, or 30 days that always ends on the delivery day, so the data is never stale. Every generated PDF also lands in the app under Reports → PDF Reports.
That's genuinely enough for a lot of teams. But it has hard limits that push you toward the API:
| Need | Scheduled PDF reports | API automation |
|---|---|---|
| Weekly email summary | Yes, built in | Yes, but you build it |
| Pipe data into Slack, BI tool, or client dashboard | No, file-based sharing only | Yes |
| Custom metrics and calculations | No | Yes |
| Multi-project rollup in one report | Limited by schedule caps | Yes |
| Historical trend database you own | No | Yes |
| Engineering effort | None | A few hours |
The number of active schedules per organization is also capped by plan, and there are no public share links, so if your client wants a live dashboard rather than a forwarded PDF, the API is the way.
Getting set up with the API
Create a key
Head to Settings → API Keys in the dashboard and create a key. You have two choices, and picking the right one saves you an hour of debugging later:
- Project-level keys are scoped to a single project. Use these for a single-site report. No extra headers needed.
- Organization-level keys can access all projects, which is what an agency wants, but every request must include an
X-Project-Idheader to resolve context. Omit it and you get a 403.
If you're managing multiple client projects, take the org key and build the project-ID handling once, in one place.
Validate and make your first call
The base URL is https://server.promptwatch.com, and every request needs an X-API-Key header. Validate your key first, then list your monitors:
# Check the key works and see what it's scoped to
curl -X GET "https://server.promptwatch.com/api/v2/auth/validate" \
  -H "X-API-Key: your-api-key-here"

# Returns key type, project, organization, and lastUsedAt

# List your monitors
curl -X GET "https://server.promptwatch.com/api/v2/monitors" \
  -H "X-API-Key: your-api-key-here"
There's a full OpenAPI spec at promptwatch.com/docs/v2/openapi.json and a Postman collection in the docs, which is handy for exploring the endpoint surface before committing to code. The v2 API spans roughly 70 endpoints: prompts, responses, citations, visibility and sentiment time series, competitor analysis, content gap analytics, query fanouts, crawler logs, visitor analytics, and more.

Respect the rate limits before you schedule anything
This is the part people skip and then wonder why their Monday job fails. Two layers of limits apply:
- Per-IP: 1,000 requests/minute, applies to everything.
- Per-organization: shared across all API keys in the org, and shared between REST and MCP. Entry tiers get around 150 requests/minute burst and 500–2,000 requests/hour; higher tiers go up to 50,000/hour.
The hourly quota resets at the top of each UTC hour, and the burst limits are derived from the hourly cap, so you can't dump 2,000 requests into the first minute of the hour even if the quota has room. On a 429, the response includes retryAfter, limit, and remaining, and there's a Retry-After header. Use it. The API will not retry for you, and neither will most schedulers.
For a weekly report pulling visibility, citations, sentiment, and crawler stats across a handful of monitors, even the lowest tier's hourly quota is plenty. The official best practices are worth following anyway: cache the models list for 24 hours, cache monitors for an hour, and pace analytics requests across your window rather than firing them all at once.
Building the weekly report script
Here's a working pattern in Python. It's deliberately simple, but it handles the three things that actually break these jobs: auth headers, 429 retries, and cursor pagination.
import time
import requests
from datetime import date, timedelta

API_BASE = "https://server.promptwatch.com/api/v2"
API_KEY = "your-api-key-here"
PROJECT_ID = "your-project-id"  # required for org-level keys

session = requests.Session()
session.headers.update({
    "X-API-Key": API_KEY,
    "X-Project-Id": PROJECT_ID,
})

def get(path, **params):
    """GET with 429 handling based on the server's own Retry-After."""
    while True:
        r = session.get(f"{API_BASE}{path}", params=params)
        if r.status_code == 429:
            wait = int(r.headers.get("Retry-After", r.json().get("retryAfter", 5)))
            time.sleep(wait)
            continue
        r.raise_for_status()
        return r.json()

def get_all_pages(path, **params):
    """Cursor pagination: pass next_cursor back exactly as received."""
    results = []
    cursor = None
    while True:
        page_params = dict(params)
        if cursor:
            page_params["cursor"] = cursor
        data = get(path, **page_params)
        results.extend(data.get("results", data.get("data", [])))
        cursor = data.get("next_cursor")
        if not cursor:
            return results

# Weekly window: last 7 days, ending today
end = date.today()
start = end - timedelta(days=7)

# 1. Citation rank analysis with weekly granularity
rank = get(
    "/api/v1/citations/rank-analysis",
    startDate=start.isoformat(),
    endDate=end.isoformat(),
    range="WEEKLY",
    domainLimit=10,
)
# rank["timeSeries"] gives date, totalCitations,
# averageRank, bestRank, worstRank per interval

# 2. Visibility time series (paginated)
visibility = get_all_pages(
    "/api/v2/visibility/time-series",
    startDate=start.isoformat(),
    endDate=end.isoformat(),
    limit=100,
)

# 3. Sentiment time series
sentiment = get_all_pages(
    "/api/v2/sentiment/time-series",
    startDate=start.isoformat(),
    endDate=end.isoformat(),
    limit=100,
)

# 4. Aggregate response stats for the week
summary = get("/api/v2/responses/summary",
              startDate=start.isoformat(),
              endDate=end.isoformat())
A few notes on the endpoints worth building a report around:
- Citation rank analysis accepts
range=WEEKLYnatively, plus filters for model, prompt type (organic, brand-specific, competitor comparison), and up to 50 domains. This is the backbone of a weekly report because it gives you total citations and average rank per interval in one call. - Visibility and sentiment time series use cursor pagination. A 60-day-plus dataset will not come back in one page, so the
get_all_pageshelper above is not optional. - Crawler logs tell you whether AI bots actually read your pages this week, which is often the explanation behind a visibility dip. If citations dropped, check whether GPTBot or ClaudeBot hit errors before you blame the content.
Add the week-over-week comparison
The whole point of automating is consistent history. Store each weekly pull in a database or even a JSON file per week, then compute deltas: citations up or down, average rank movement, sentiment shift, which prompts gained or lost visibility. A simple previous_week.json comparison turns a data dump into something a CMO will actually read.
Deliver it somewhere useful
This is where the API route beats the PDF: you're not limited to email. Common patterns:
- Post a summary to Slack every Monday (the Slack API makes this a 20-line addition).
- Write rows to Google Sheets with
gspreadso stakeholders keep their familiar spreadsheet, but it's now populated automatically with identical filters every week. - Push into Looker Studio via its connector or into any warehouse, then let the BI layer handle charts.
- Generate an HTML email with inline sparklines if you want something prettier than raw numbers.
Scheduling the job
There are no webhooks in Promptwatch, so this is pull-based by design. Pick a scheduler and keep it boring:
- cron on any small server:
0 7 * * 1 /usr/bin/python3 /opt/reports/weekly_ai_visibility.py - GitHub Actions works well if the script lives in a repo. Store the API key as a secret, run on a
schedule: cron: "0 7 * * 1"trigger, and you get logs and failure alerts for free. - Cloud functions (Lambda, Cloud Functions) with a scheduled trigger if you're already in that ecosystem.
One tip: schedule for early Monday UTC but after the top of the hour, so you're not competing with the hourly quota reset alongside everyone else's jobs. And set up failure alerting. A silent broken cron is worse than a manual export, because at least the manual export failing is visible.
Gotchas I'd rather you learn from this guide than from production
The engineering quirks below come from people who've built against this API already, and they're the difference between a script that works on the first run and one that fails on week two:
- Org keys and the missing header. Visibility and citation endpoints fail with 401 or 403 when an org-level key doesn't carry
X-Project-Id. Project-level keys don't have this problem. If you see 403s on endpoints that worked in Postman, this is almost always why. - Cursors are opaque strings. Pass
next_cursorback exactly as received. Don't re-encode it, don't trim it, don't try to base64-decode it and reconstruct pages. - Content endpoints are async. If your weekly workflow also triggers content generation to fill a visibility gap,
POST /content/createreturns immediately with aPENDINGdocument ID, and you pollGET /content/:iduntil it'sCOMPLETEDorFAILED. Reporting endpoints are synchronous, so this only matters if report and remediation are one pipeline. - No webhooks means no push. Your job polls on a schedule. Don't build anything that assumes Promptwatch will tell you when data is ready.

When the API route isn't worth it
Honesty check: if your entire need is "email my team a PDF every Monday," the built-in scheduled reports do that with zero code and you should use them. The API earns its keep when you need the data somewhere other than a PDF, when you need custom metrics, or when you're an agency rolling up multiple client projects into one view.
If you're evaluating platforms specifically for API-based reporting, it's worth knowing the landscape isn't uniform. Some tools still describe their workflow as "export weekly CSV, or pull via API if available to you," which tells you API access isn't standard. A few alternatives worth a look if you're comparing:
| Tool | API story | Model coverage | Best for |
|---|---|---|---|
| Promptwatch | API + MCP on every plan, ~70 endpoints, cursor pagination | All major models included on every tier | Teams that want full pipeline control |
| ZipTie | API-first by design | Multi-model | Teams piping citations into their own dashboards |
| Peec AI | API access inconsistent across plans; extra models cost $22–33/month each | Add-on pricing per model | Budget-conscious tracking |
| Profound | Enterprise API | ChatGPT only on Starter ($99/mo), 3 models on Growth ($399/mo) | Enterprise deployments |
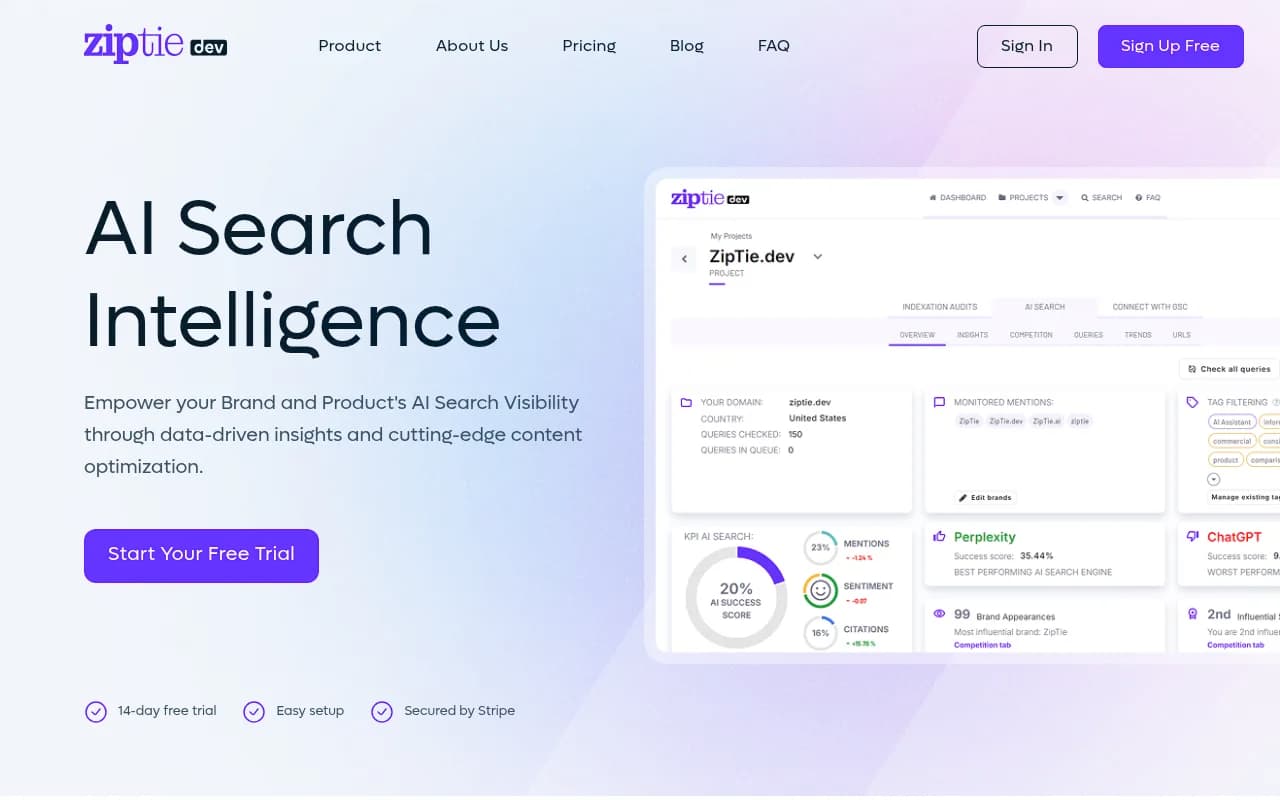
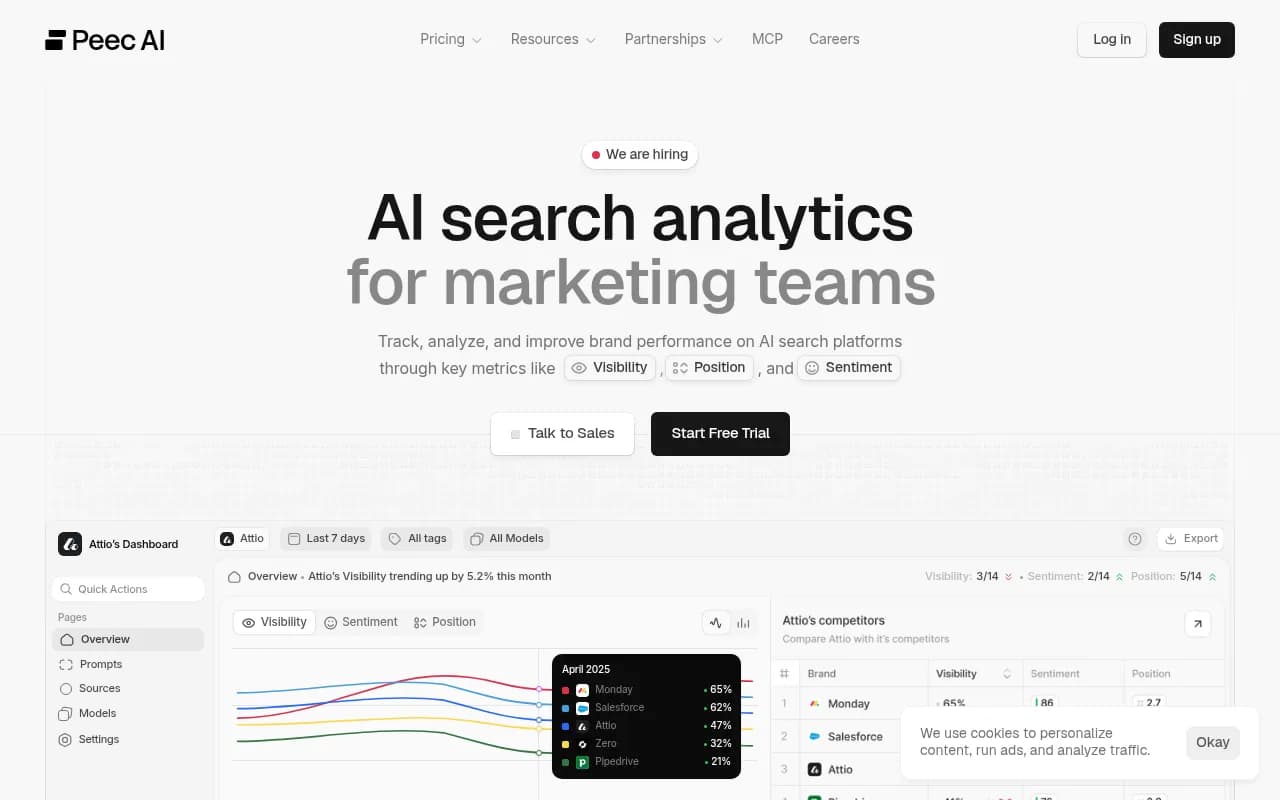
The model coverage point matters more than it looks. A weekly report that silently stops covering Grok or Perplexity because of a plan limitation is exactly the kind of drift automation is supposed to prevent. You can browse more options in the GEO software directory at bestgeosoftware.com if you're still weighing platforms.
Wrapping up
The manual export workflow isn't just tedious, it's fragile: filters drift, weeks get skipped, and the Copilot-style volatility in AI search means a single hand-pulled snapshot can mislead you about your own performance. The fix is a few hours of work: a project or org API key, a script that handles the X-Project-Id header, cursor pagination, and Retry-After on 429s, and a cron job that runs before your team opens their laptops on Monday. Store the history, compute the week-over-week deltas, and deliver it where people actually look, whether that's Slack, Sheets, or a client dashboard. Once the first automated report lands, you'll wonder why you ever did this by hand.