Key takeaways
- The core formula is unchanged: (attributed revenue minus total investment) divided by total investment, times 100. What changes in AI SEO is how you attribute revenue and what you count as cost.
- Split your metrics into leading indicators (crawler access, citations, visibility score) and lagging ones (AI referral sessions, conversions, revenue). Only the second group belongs in an ROI number.
- Track every AI engine separately. Social-driven visibility in particular can vanish from one engine and persist in another.
- Treat citations as a decaying asset. Budget for refreshes, and expect news and PR wins to fade fast.
- Give it 6 to 12 months for traditional SEO to turn positive, and set expectations for AI channels with a clear baseline taken before you start.
Why AI SEO ROI is harder to pin down
Traditional SEO ROI is already awkward. Traffic goes up, revenue doesn't, and someone in finance asks what the retainer is for. AI search adds three more problems.
First, a lot of the value is invisible. A buyer asks ChatGPT for the best tools in your category, your brand gets named, and they type your URL into a browser a day later. No referrer, no click, just "direct" traffic in your analytics.
Second, the platforms behave differently from each other and change without notice. Third, most of the ROI articles you will find online are generic digital marketing pieces. They give you CTR and CPL definitions, but nothing about citation share, brand mentions, or AI referral traffic.
So here's an approach that works with what's actually measurable. It borrows the solid parts of classic SEO ROI math and adds the AI-specific layers on top.
Start with the formula, then fix the inputs
The basic calculation is the one everyone uses:
AI SEO ROI (%) = ((Attributed revenue - Total investment) / Total investment) x 100
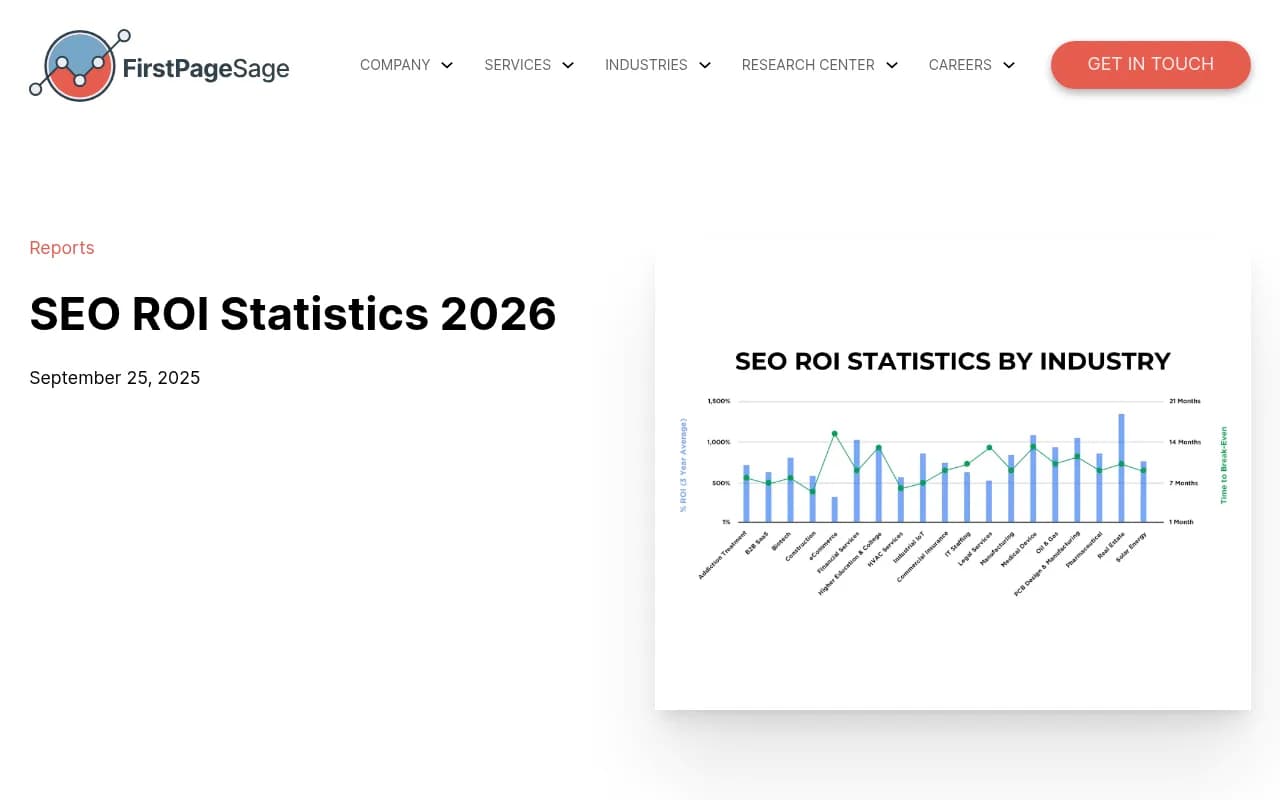
First Page Sage defines SEO ROI the same way: net profit from the campaign divided by campaign costs, multiplied by 100. Their data (campaigns from Q1 2021 to Q3 2025) puts the median SEO ROI at 748%, with industries ranging from 317% for eCommerce to far higher in other verticals. Those are classic SEO numbers from an agency selling thought-leadership campaigns, so use them as a rough sanity check, not a promise.
The formula is easy. The inputs are where people cheat themselves.
What belongs in total investment
Count all of it, not just the software invoice:
- The AI visibility platform or tool subscriptions
- Agency or consultant fees
- Content production, including freelancers and editing
- Internal time. A share of salary for everyone who touches the work, which is how First Page Sage costs its own campaigns
- Developer time for technical fixes such as crawler access, schema, and CDN rules
- Refresh costs. More on this below
If you leave out internal time, your ROI looks great and your CFO stops believing you the first time they check.
What belongs in attributed revenue
This is the hard part, and it deserves its own section.
Set a baseline before you change anything
One piece of the Stridec framework in the research is worth keeping: establish a baseline, using something like a six-month pre-change average. Their ROI table (180 to 380% with 5 to 14 month paybacks) comes from an agency blog with no visible methodology, so I would not use those figures as benchmarks. The baseline idea, though, is sound.
Before you spend anything, record:
- Organic sessions and conversions from Google and Bing, by landing page
- Referral sessions from chatgpt.com, perplexity.ai, gemini.google.com, copilot.microsoft.com and similar sources
- Branded search volume and direct traffic (a rough proxy for AI-driven awareness)
- A fixed set of 50 to 150 buyer prompts and your current visibility, position, and sentiment in each AI engine
- Current AI crawler activity on your site
Without this, every later improvement is an anecdote. With it, you can say "we went from 3% to 14% share of voice on these prompts and AI referral conversions went from 11 a month to 60."
Leading indicators versus lagging indicators
This is the distinction I would push hardest. Many teams stuff visibility scores into an ROI report and then wonder why finance shrugs. A visibility score is not revenue. It is evidence that revenue might follow.
| Metric | Type | What it tells you | Belongs in the ROI formula? |
|---|---|---|---|
| AI crawler visits and errors | Leading | Whether AI systems can read your pages at all | No |
| Citation count and citation rank | Leading | Whether your pages show up as sources | No |
| Visibility score and share of voice | Leading | How often you appear for tracked prompts | No |
| Sentiment and position in answer | Leading | How you are described and how early | No |
| AI referral sessions | Lagging | Actual visits from AI platforms | Partially |
| AI-referred conversions | Lagging | Leads, signups, and sales from those visits | Yes |
| Assisted conversions and branded lift | Lagging, indirect | AI-influenced demand that shows up as direct or branded | Yes, as a clearly labeled estimate |
| Revenue per AI session | Lagging | Quality of AI traffic versus other channels | Yes |
Crawler-log analysis is a good example of the trap. Promptwatch Data's AI crawler traffic report (IP-verified requests, June 8 to September 6, 2026) shows OpenAI's share of verified AI crawler requests falling from 94.8% to 79.8% over that window. If you compare your own logs with that mix and a major provider is near zero on your site, you probably have a blocking problem in robots.txt, your CDN, or a WAF rule. That is a diagnostic and a leading indicator. It is not a revenue metric, and it should never appear in the numerator.
Attributing revenue to AI search
There are four layers, from most to least certain. Report them separately instead of blending them into one flattering number.
Layer 1: direct referral traffic
Set up a GA4 channel group or segment for AI referrers. Match on source domains for ChatGPT, Perplexity, Gemini, Copilot, Claude, and so on. Then pull sessions, conversions, and revenue for that segment. This is the number you can defend in any meeting.
Known limits: some AI interfaces strip referrers, and apps open links in ways that get misclassified as direct. Your real number is higher than what you see.
Layer 2: page-level correlation
Join three things per page: AI crawls, AI citations, and traffic. A page that gets crawled, cited, and then sees its AI referral sessions climb is a clean story. A page that is cited often but gets no clicks is telling you something too, probably that the answer satisfied the reader without a visit.
Platforms that combine crawler logs, citation data, and search console data in one view make this much easier than stitching spreadsheets together.
Layer 3: assisted and branded lift
Watch branded search impressions and direct traffic over time against your visibility trend. If your share of voice for category prompts rises and branded search follows a few weeks later, that is suggestive. It is not proof. Label it as an estimate and keep it out of the headline ROI figure unless your finance team agrees on a method.
Layer 4: self-reported attribution
Add "How did you hear about us?" to your signup or demo form, with ChatGPT, Perplexity, and "AI assistant" as options. It is crude, and it often reveals more AI influence than analytics does. Use it to calibrate Layer 3.
Measure per engine, not in aggregate
One blended "AI visibility" number hides what is actually going on. Promptwatch Data's social media citations report (September 28 to October 4, 2026) shows how different the engines are. ChatGPT drew just 0.46% of its citations from social platforms, while Google AI Overviews drew 12.2%, about 26 times as much. Reddit's share of ChatGPT citations fell from 5.19% to 0.09% in that report, after the August collapse.
If your AI SEO plan relied on Reddit seeding to win ChatGPT citations, your ROI on that tactic changed overnight, for reasons that had nothing to do with your execution. If you only track a blended score, you will not see that until someone asks why the line dropped.
Practical rule: keep a baseline and a trend for each engine, and attribute spend by tactic where you can. Then a platform change shows up as one tactic's ROI shifting, not as the whole program mysteriously failing.
Model citations as a decaying asset
A blog post's value in traditional SEO decays slowly. In AI search, it varies a lot by content type. Promptwatch Data's content half-life study tracked every page ChatGPT cited on July 6, 2026 for 90 days. Findings:
- After 30 days, 78% of landing pages and 76% of docs were still being cited, along with 72% of comparison pages
- After 60 days, landing pages were at 69%, docs 67%, comparisons 63%, listicles 60%, and product pages, reviews and how-tos around 55%
- News lost half its pages within 36 days, and almost a quarter were never cited again after day 0
What does that mean for ROI? A news-style PR win that earns citations this month is worth a fraction of a documentation page that keeps earning them for quarters. When you calculate ROI, treat each content type's return over its realistic lifespan and add the cost of keeping it alive. A refresh is a recurring cost line, not a surprise.
In practice I would build a simple table per content type: production cost, expected citation lifespan, refresh cost, and revenue per month while cited. Then compare cost per cited-month across types. It is an unglamorous spreadsheet. It also tends to show that boring docs and comparison pages beat flashy launches.
Time horizons and what to report when
SEO investment generally takes 6 to 12 months to turn positive and often peaks in years two and three, according to the 2POINT piece in the research. First Page Sage's break-even figures range from about 5 months (construction) to 9 months (eCommerce). AI search is younger and noisier, so I would not promise faster.
A reporting cadence that works:
| Timeframe | What to report | What to avoid |
|---|---|---|
| Month 1 to 2 | Baseline, technical fixes shipped, crawler access confirmed | Any ROI percentage |
| Month 3 to 4 | Citation and visibility movement per engine, first AI referral sessions | Revenue claims from correlation alone |
| Month 6 | AI-referred conversions, revenue per session, first ROI estimate | Blending estimates with hard attribution |
| Month 9 to 12 | Full ROI with all four attribution layers shown separately, refresh costs included | Extrapolating a trend line as if it were fact |

A worked example
Say you run a B2B SaaS company and spend the following over six months on AI SEO:
- Platform subscription: $3,500
- Content production and refreshes: $18,000
- Developer time for crawler and schema fixes: $4,000
- Internal marketing time: $9,000
Total investment: $34,500.
At the end of that period, GA4 shows AI referral sessions produced 140 signups, and your trial-to-paid rate and average contract value yield $52,000 in new revenue from those signups. Your self-reported attribution suggests roughly 30% more AI-influenced deals that landed as direct traffic, which you estimate at another $15,000 but report separately.
Hard-attribution ROI: ($52,000 - $34,500) / $34,500 x 100 = about 51%.
With the estimate included: ($67,000 - $34,500) / $34,500 x 100 = about 94%.
Show both. The 51% is the number nobody can argue with. The 94% is the one that is probably closer to the truth. Showing the gap is more credible than quoting only the bigger one.
Tools that help you measure it
You do not need a specific tool to do the math. You do need data you cannot easily get by hand: prompt-level visibility across engines, crawler logs, and citation tracking tied to traffic.
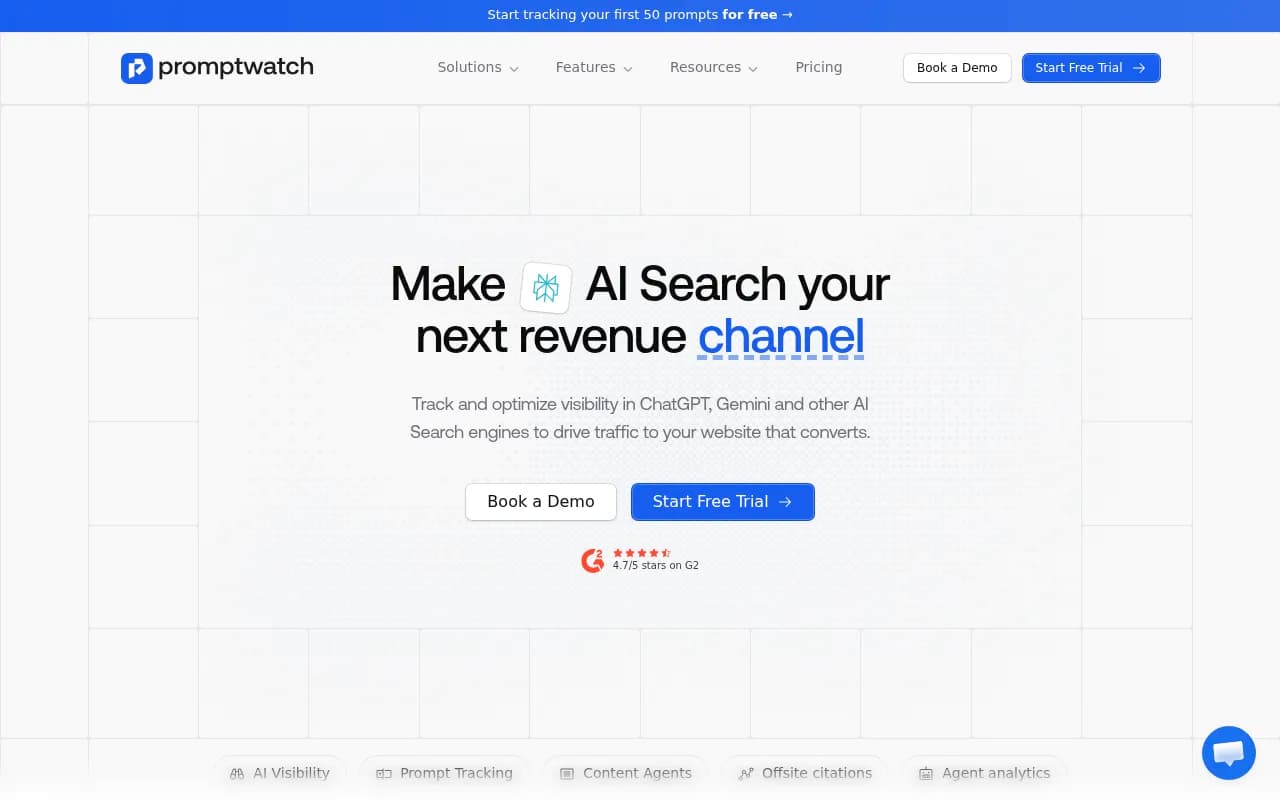
Promptwatch is one option that covers most of the chain in one place, from real-UI prompt tracking and IP-verified AI crawler logs to visitor analytics that connect AI traffic to conversions, plus content tools that act on the gaps it finds. That matters for ROI specifically because the leading and lagging metrics sit side by side and per page.
Other tools in this space tend to specialize in one part of the problem:
| Tool | Strongest angle for ROI work |
|---|---|
| Trakkr | Tracing AI visitors to revenue |
| Passionfruit | Connecting LLM citation tracking to revenue attribution |
| LLMclicks.ai | Tracking clicks and traffic from AI search engines |
| Omnibound | Tying B2B AI search visibility to pipeline |
| Profound | Enterprise AI visibility analytics |
| Semrush AI Visibility Toolkit | AI tracking inside an existing SEO suite |
| Ahrefs Brand Radar | Brand mentions across AI engines |
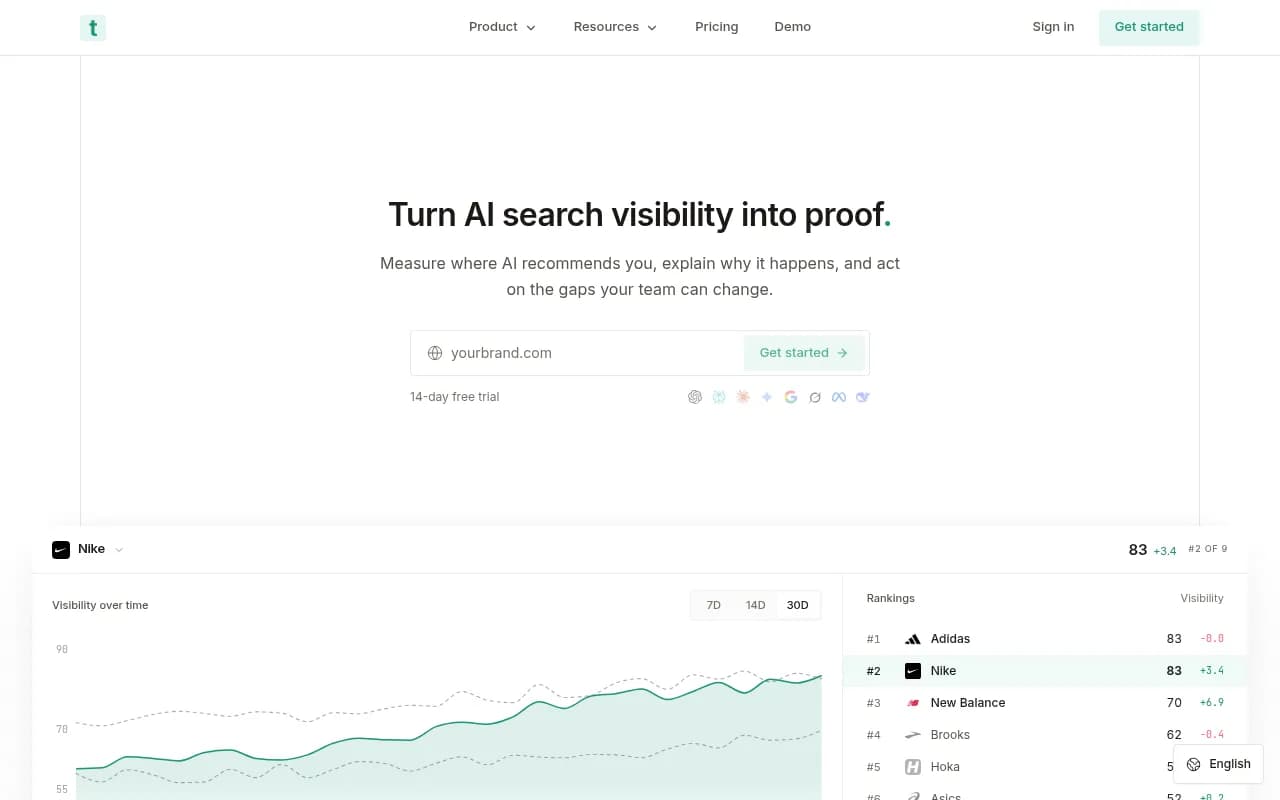

I have not benchmarked these against each other for this guide, so check current pricing and features on each vendor's site. If you want a wider list, the GEO software directory at bestgeosoftware.com is a good place to compare options by category.
Whatever you choose, ask a vendor three questions before signing. Does it track the real user interface of each AI engine or only API responses? Can it show crawler activity, not just mentions? Can it connect visibility to sessions and conversions on your site? A tool that answers "no" to the third one will make your ROI report harder, not easier.
Common mistakes
Reporting visibility as if it were revenue
A higher visibility score is a good sign. Put it in a separate section from ROI.
Ignoring the baseline
If you did not measure before you started, you cannot claim the lift. Start now, even if the program has already begun, and note the date.
Forgetting internal costs
The subscription is the cheap part. Writers, editors, developers, and your own time are usually the bulk of the bill.
Blending engines
One tactic can collapse on one engine and thrive on another, as the Reddit data shows. Aggregate numbers hide it.
Using someone else's benchmark as your target
Median ROI figures from agency reports are marketing material as much as research. Industry ranges help you sanity-check, and that is about all they are good for. Your own baseline matters more.
Ignoring decay
If half your content is news-style, your citation-driven revenue will fade faster than the spreadsheet assumes. Plan the refresh budget up front.
A short checklist
- Record baseline organic, AI referral, branded, and prompt-visibility data before you start.
- Build a GA4 segment for AI referrers and tag conversions.
- Add an AI option to your "how did you hear about us" field.
- Verify AI crawler access in robots.txt, CDN, and WAF rules.
- Track visibility, citations, and sentiment per engine.
- Log total costs monthly, including internal time and refreshes.
- Report hard-attribution ROI and estimated ROI separately.
- Review per-content-type lifespan every quarter and reallocate budget.
If you would rather hand parts of this to specialists, agencies such as 1001 SEO Media run AI search and GEO work with transparent monthly reporting, which at least gives you a consistent set of numbers to feed into the formula above.
The short version: the math is easy, and the discipline is in the baseline, the attribution layers, and an honest cost column. Get those right and the ROI number takes care of itself, whatever it turns out to be.