Key takeaways
- A useful AI visibility dashboard puts four things side by side: visibility, position, sentiment, and share of voice. A heatmap lets you cross any two dimensions (brand by model, topic by country) in one view.
- You can build one in about 30 minutes if your prompts are already defined. The slow part is deciding what to track, not clicking through the setup.
- Two routes work: a DIY build (Google Sheets plus Looker Studio or an AI-built dashboard) or a platform with heatmaps built in. DIY is cheaper and fiddly. A platform is faster to maintain.
- Normalize your time windows. Mixing 7-day and 30-day data in one chart is the most common way to fool yourself.
- Pair AI data with Search Console data. The interesting findings come from pages that AI cites but Google never clicks, or the reverse.
What a heatmap does that a line chart does not
A line chart tells you your visibility went up. A heatmap tells you where. Put brands on one axis and AI models on the other, color each cell by visibility score, and you see in two seconds that you do fine in Perplexity and barely exist in Google AI Overviews.
That matters because the engines behave very differently. Promptwatch's November 2026 social citation data (Oct 11 to Nov 9, 2026) shows social platforms earn 13.16% of Google AI Overviews citations, 1.94% of Perplexity's, and 0.64% of ChatGPT's. YouTube alone is 6.71% of AI Overviews citations. An average across engines hides all of that. A heatmap does not.
One warning before we start. Heatmaps in this guide are AI visibility heatmaps: grids of brands, models, topics, or countries colored by a metric. They are not the click-and-scroll heatmaps you get from tools like Microsoft Clarity, which show on-site user behavior. Different thing, same word.
Step 1: Decide what the dashboard needs to answer (5 minutes)
Write down the three questions you want answered every Monday. Mine would be:
- Are we showing up more or less than our top four competitors?
- Which topics are we losing, and in which models?
- Are the pages AI cites also the pages sending traffic?
Everything on the dashboard should serve one of those. If a widget doesn't, cut it.
Pick the metrics
Four metrics cover most of it. Read together, they point at the problem.
| Metric | What it tells you | If it's weak, the problem is... |
|---|---|---|
| Visibility score | How often and how prominently you appear | Coverage |
| Share of voice | Your slice of all brand mentions | Competitive position |
| Average position | Where you land in the answer's brand order | Prominence |
| Sentiment | Tone of what AI says about you | Reputation |
Add a fifth if you can: self-citation rate, the share of citations that point at your own domain. Mentions without self-citations usually mean a content or crawlability problem, not a awareness problem. The Promptwatch academy has clean definitions if you need to explain these to a stakeholder.
Step 2: Build your prompt set (8 minutes)
This is the part people rush and then regret. A dashboard is only as good as the prompts feeding it.
Start with 50 to 100 prompts. Group them three ways:
- By topic or product line (so the heatmap has rows)
- By intent: informational, commercial, branded, competitor comparison
- By market, if you sell in more than one country or language
Keep branded and generic prompts separate. If you blend "best CRM for startups" with "is YourBrand any good", your visibility number will look great and mean nothing.
Two cheap ways to find prompts: pull queries from Search Console and rephrase them as questions, and run your category through a query fan-out tool to see the sub-searches AI actually runs. The free ChatGPT query fan-out generator is a decent starting point. Promptwatch's fan-out data shows how many searches ChatGPT fires per response, which is usually more than people assume.
Step 3: Choose your route
There are two sensible ways to get a heatmap dashboard running.
Route A: a platform with heatmaps built in
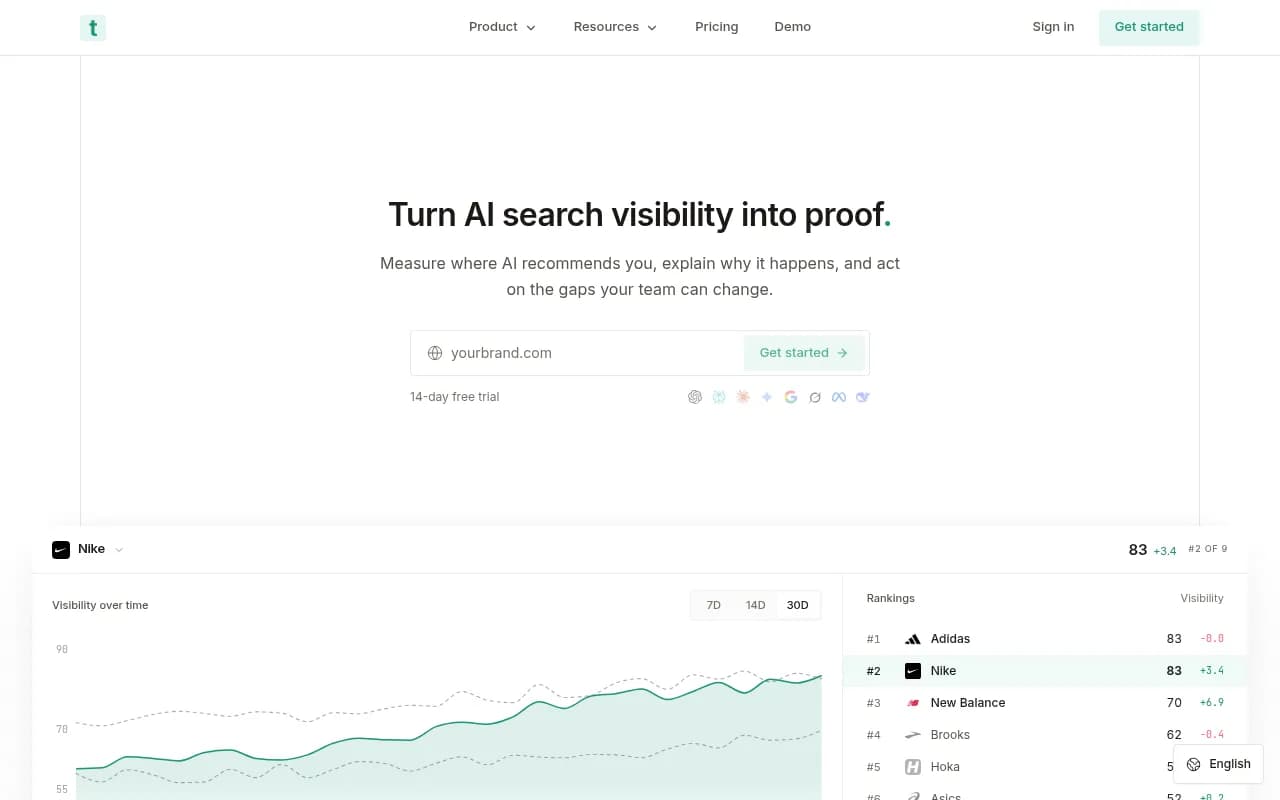
If you want the 30-minute version to be literally true, use a platform where collection, scoring, and visualization live together. Promptwatch is the one I'd point most teams to here. Custom dashboards let you choose and order widgets (visibility over time, sentiment, visibility by country map, persona radar, top cited domains and URLs, top YouTube videos, Reddit posts), and the heatmap puts brands, models, topics, countries, or personas on either axis, colored by visibility, sentiment, position, or share of voice. It also tracks the real interfaces of ChatGPT, Google AI Overviews, Google AI Mode, Gemini, Perplexity, Copilot and others rather than API outputs, which matters because user-facing answers and citations can differ from API answers.
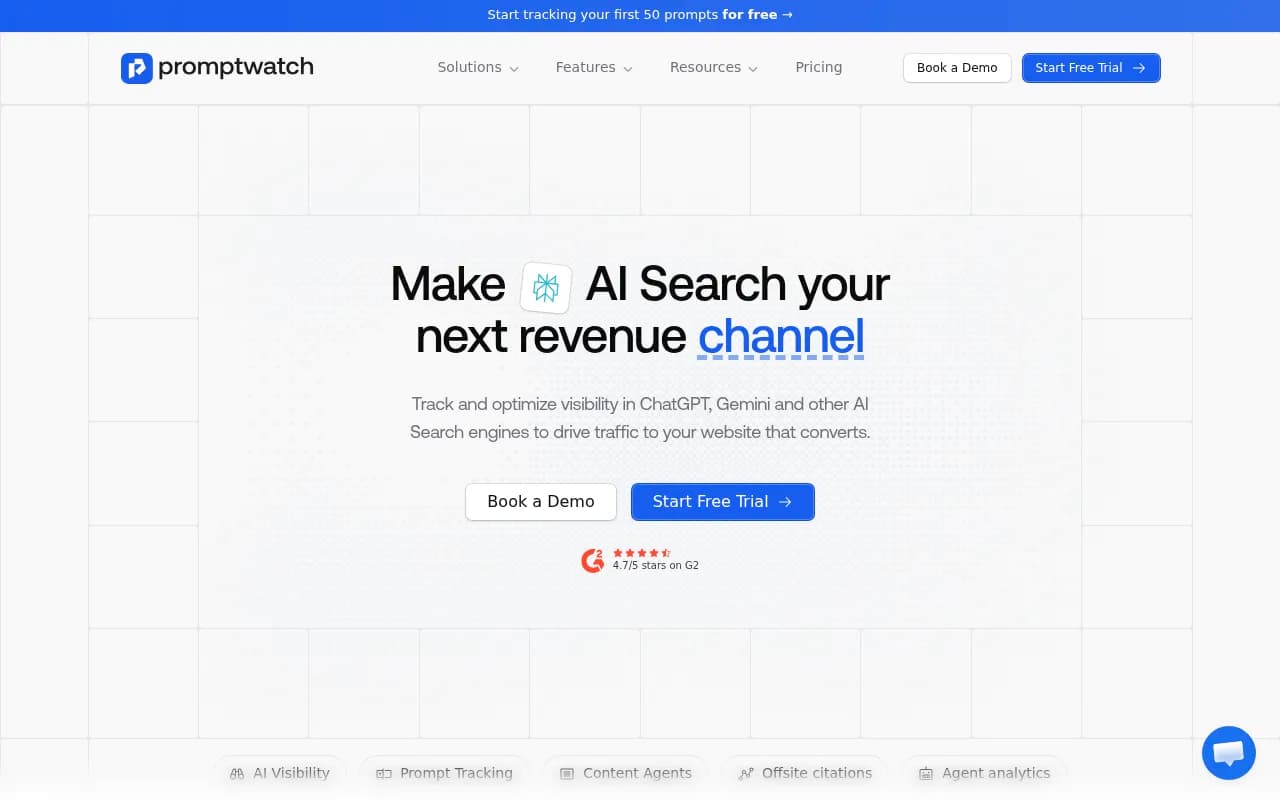
The shortcut: Agent Chat can build or edit a dashboard for you if you describe it in plain language, something like "competitor comparison by AI model, with a sentiment heatmap by topic." Templates (competitor comparison, topic gaps, AI model breakdown, citations) cover the common cases, and an A/B chart compares two time periods. Plans start at $95/mo with a 7-day free trial; confirm current details at promptwatch.com/pricing.
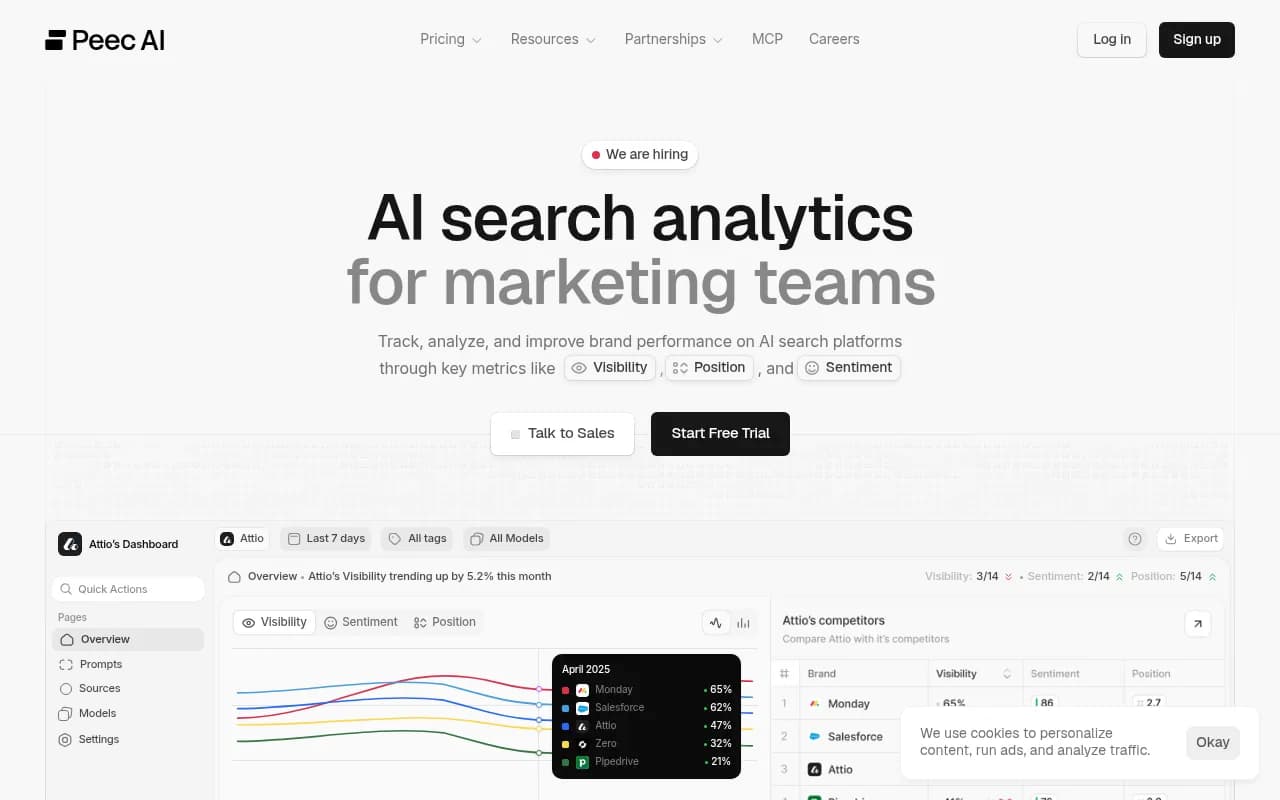
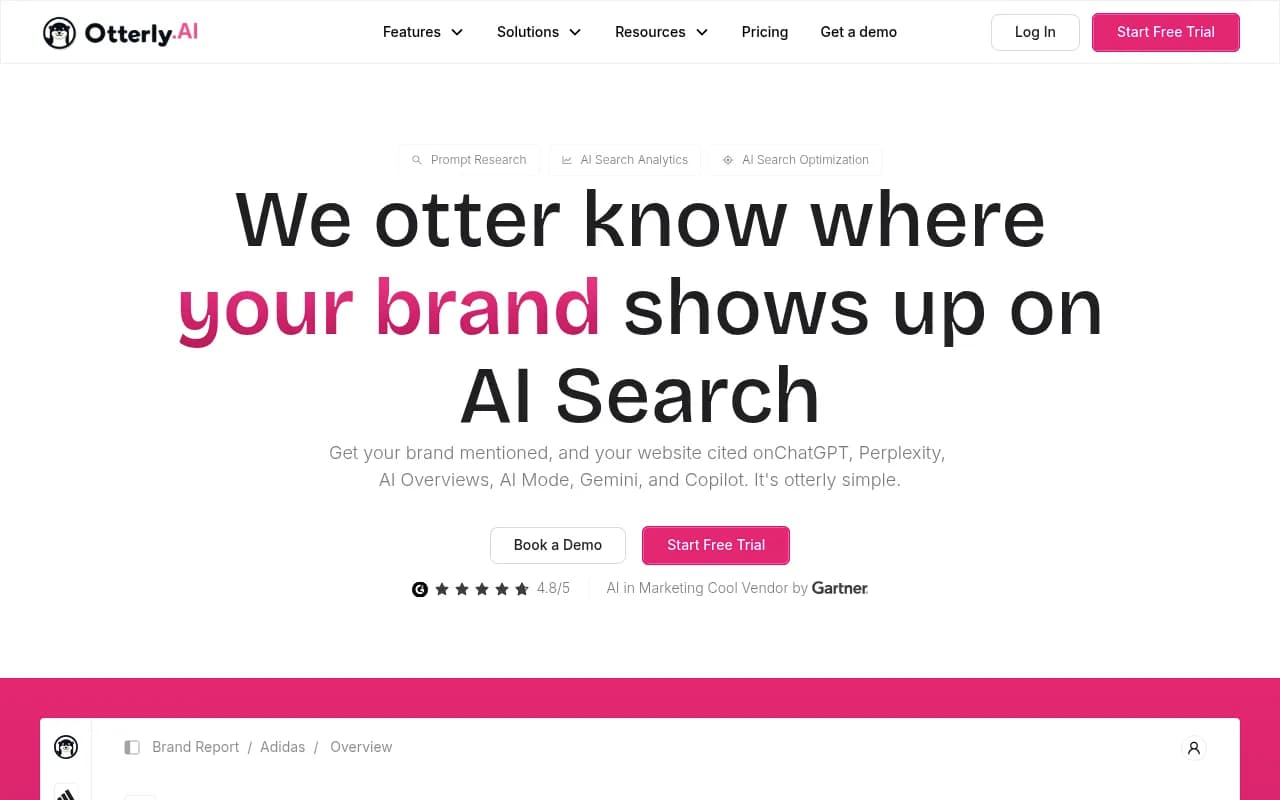
Other platforms in this space track visibility with their own dashboards, and some are worth a look depending on budget and team size:
For a broader list, the GEO software directory at bestgeosoftware.com is organized by category.
Route B: the DIY build
If you'd rather own the pipeline, the pattern is a spreadsheet as the data layer and a visualization tool on top. Semrush's own walkthrough (Oct 2026) pairs prompt-level AI data with page-level Search Console data in Google Sheets, then has Claude turn the Sheet into an interactive dashboard. The author says the first build took about 90 minutes and weekly updates take around 20. On their test site, the first refresh surfaced a guide cited for 50 prompts that earned zero Google clicks. That is exactly the kind of finding a combined dashboard exists to produce.
Trakkr's how-to guide takes a similar approach with Looker Studio, Tableau, or Power BI, and suggests weighting mentions (an early mention in a ChatGPT answer counts more than one buried at the end).
Honest take on DIY: 30 minutes is optimistic. Realistically it's 30 minutes for the layout and a few hours for the data plumbing, and then someone has to keep it alive. If you already live in Looker Studio, it's a fine choice. If you don't, the platform route wins.
| Factor | Platform with built-in heatmaps | DIY (Sheets plus Looker Studio or AI-built) |
|---|---|---|
| Time to first dashboard | Minutes after prompts are set | Hours, mostly data wiring |
| Data collection | Included | You supply it (exports, APIs, scripts) |
| Heatmap flexibility | Axes and metrics selectable | Whatever you build |
| Maintenance | Low | Weekly manual refresh or scripts |
| Cost | Subscription | Cheaper tools, more of your time |
| Best for | Teams who want answers, not plumbing | Analysts who want full control |
Step 4: Set up monitors the heatmap can slice (5 minutes)
Whichever route you pick, structure matters more than volume.
In a platform like Promptwatch, a monitor is a panel of prompts that runs across the models, countries, and languages you choose. Language and location are fixed when you create a monitor, so markets never blend. That is a feature. If you sell in the US and Germany, build two monitors, not one confused one.
Tips that save pain later:
- Name topics and tags now. Heatmap rows come from them.
- Add competitors up front, three to five. Auto-discovered ones are useful but check them.
- Write brand aliases and, if your brand name is also a common word, analysis instructions that say what counts as a mention.
- Use personas if your buyers differ. A persona radar shows where the gap between a CFO and a developer is widest.
Tracking runs daily on every plan. Business and above can go faster (every 12, 6, or 1 hours), which only matters during a launch or campaign.
Step 5: Build the heatmaps (7 minutes)
Three heatmaps cover 80% of decisions. Build these first.
Brand by model
Rows are you and your competitors. Columns are ChatGPT, AI Overviews, AI Mode, Gemini, Perplexity, Copilot. Color by visibility score. This shows where each engine favors someone else.
If one column is cold across the board, check citations before blaming content. Google surfaces and ChatGPT draw from quite different source mixes. Promptwatch's domain rank distribution report (Nov 3 to 16, 2026) shows DR 91 and up earns 17.9% of AI Overviews citations but only 3.0% of ChatGPT's, while DR 61 to 90 sites earn 41.2% of ChatGPT's. A brand with strong mid-authority coverage can look great in ChatGPT and weak in AI Overviews for entirely structural reasons.
Topic by country
Rows are topics, columns are countries, color by share of voice. This is how you find the market where you're strong in pricing questions but absent from comparison questions.
Topic by competitor, colored by sentiment
The one people skip and then wish they hadn't. Visibility with bad sentiment is not a win. Brand Narrative in Promptwatch pulls the individual claims AI makes about you ("affordable for small teams", "its mobile app lacks features") and scores themes like pricing, features, support, and reputation from 0 to 100, so you can see whether a cold cell is about absence or about what's being said.
Reading the colors without fooling yourself
- Fix your color scale across time periods, or last month and this month won't be comparable.
- Watch sample size. A cell built from three responses is noise.
- Responses that don't mention you should count as zero, not be dropped. Dropping them inflates everything.
- Normalize window lengths. Promptwatch's own October social report covered 7 days and the November one covers 30, so a naive month-over-month chart would mislead. YouTube's share of AI Overviews citations went from 4.28% to 6.71% between those reports, and part of any apparent movement can be window length.
Step 6: Connect traffic and crawl data (5 minutes)
Visibility without outcomes is a vanity chart. Add two more panels.
Search Console overlay
Put page-level Google clicks next to AI citations. Look for two groups: pages AI cites that earn no Google clicks (you're being used as a source, and maybe not getting the click), and pages that rank well in Google but are never cited (a content or access problem). Promptwatch's Search Insights overlays Search Console and Bing Webmaster data with AI crawls, citations, and clicks per page, which saves you the join.
AI crawler logs
If AI bots can't read a page, no heatmap will fix it. Check verified crawler requests per provider. Promptwatch's AI crawler traffic report shows OpenAI at 79.8% of verified requests in Aug 31 to Sep 6, 2026, down from 94.8% in the week of June 8. The report's advice is sensible: compare your own logs to that mix, and if a provider is big in the report but near zero on your site, suspect a robots.txt, CDN, or WAF block. Promptwatch's crawler logs cover this, and the free Agentic Readiness Check is a quick first test.
AI-referred visits
Add a visitor analytics panel. One wrinkle: ChatGPT stopped sending a referrer on October 8, 2026, so you'll want to count visits tagged utm_source=chatgpt.com as ChatGPT traffic. The Academy page on attributing AI traffic walks through it.
Step 7: Add the action layer (the part dashboards usually lack)
A dashboard that only reports is homework for someone else. Two additions turn it into a working tool:
- A gaps panel: prompts where competitors appear and you don't, with the pages AI cites for them. The content gap guide explains the method.
- A to-do list. Promptwatch's Action Board generates a prioritized list from the data, and a weekly digest email lands every Monday.
The result in practice: Crisp reported 2x higher conversion rates from AI traffic than traditional channels after acting on this kind of data (case study).
Which tool for which team
| If you are... | Consider |
|---|---|
| An SEO or marketing team that wants heatmaps, crawler logs, and content actions in one place | Promptwatch |
| Already deep in the Semrush ecosystem | Semrush AI Visibility Toolkit |
| An enterprise team with a large budget | Profound or Brandlight |
| A small team wanting basic monitoring | Otterly.AI or Peec AI |
| An analyst who wants full control | Sheets plus Looker Studio |
| An agency managing many clients | Agency plans with unlimited projects (Promptwatch Kick-off starts at $199/mo) |
For a wider scan, the AI rank tracking directory lists more options.
A 30-minute run sheet
- Minutes 0 to 5: write your three questions and pick four metrics.
- Minutes 5 to 13: assemble 50 to 100 prompts, grouped by topic and intent.
- Minutes 13 to 18: create monitors per market, add competitors and aliases.
- Minutes 18 to 25: build the three heatmaps.
- Minutes 25 to 30: add Search Console and crawler panels, schedule a weekly PDF.
That only works if data is already flowing. Tracking needs a day or so to populate, so build the layout first and read it tomorrow.
Common mistakes
- Tracking too many prompts and reading none of them. Fifty good ones beat 500 random ones.
- Treating a single week's color shifts as trends. Models change behavior abruptly: ChatGPT's reddit.com share of citations fell from roughly 4% to 0.5% on August 14, 2026, per Promptwatch's data, with no change on anyone's site.
- Ignoring content type. Product pages are 22.4% of ChatGPT citations (Sep 28 to Oct 4, 2026) per the content type report, so if you only publish blog posts, expect some cold cells.
- Skipping a baseline. Run the free AI visibility report before you build anything, so you know what normal looks like.
Next steps
Build the layout this week, let data accumulate for a few days, then do your first real read. Share the dashboard as a scheduled PDF so people see it without logging in. If the first read shows gaps, start with the three coldest cells for your highest-value topic. Fix those, check again in two weeks, and keep the loop going. If you'd rather hand the whole thing to specialists, an agency such as 1001 SEO Media runs GEO programs end to end.