Key takeaways
- Build one report with two layers: a two-minute CEO summary and an engineering appendix. Same data, different decisions.
- Fix the prompt set before month one and change it only on a schedule. Without that, month-to-month charts are noise.
- Lead with one headline number in context, then show leading indicators (citations, crawl access, docs coverage) that move before the headline does.
- For dev tools, the sources that matter are GitHub, docs and review sites. Report on those, not just on brand mentions.
- End every report with the next three actions and an owner for each.
Why dev tool reporting is different
Most AI visibility templates are written for agencies reporting to retail or ecommerce clients. A developer tool has a different problem. Your buyer asks ChatGPT "best feature flag SDK for Go" or "how do I add auth to a Next.js app," and the answer is built from docs, GitHub repos, Stack Overflow-style threads and a few review sites. Your marketing site is often the least important source.
So the report has to speak to two people. The CEO wants to know whether the company shows up when buyers ask, whether that is improving, and whether it produces signups. The engineering lead wants to know which docs pages, READMEs and repos are being read or ignored by AI crawlers, and what to ship. If you hand both of them the same dashboard screenshot, neither is served.
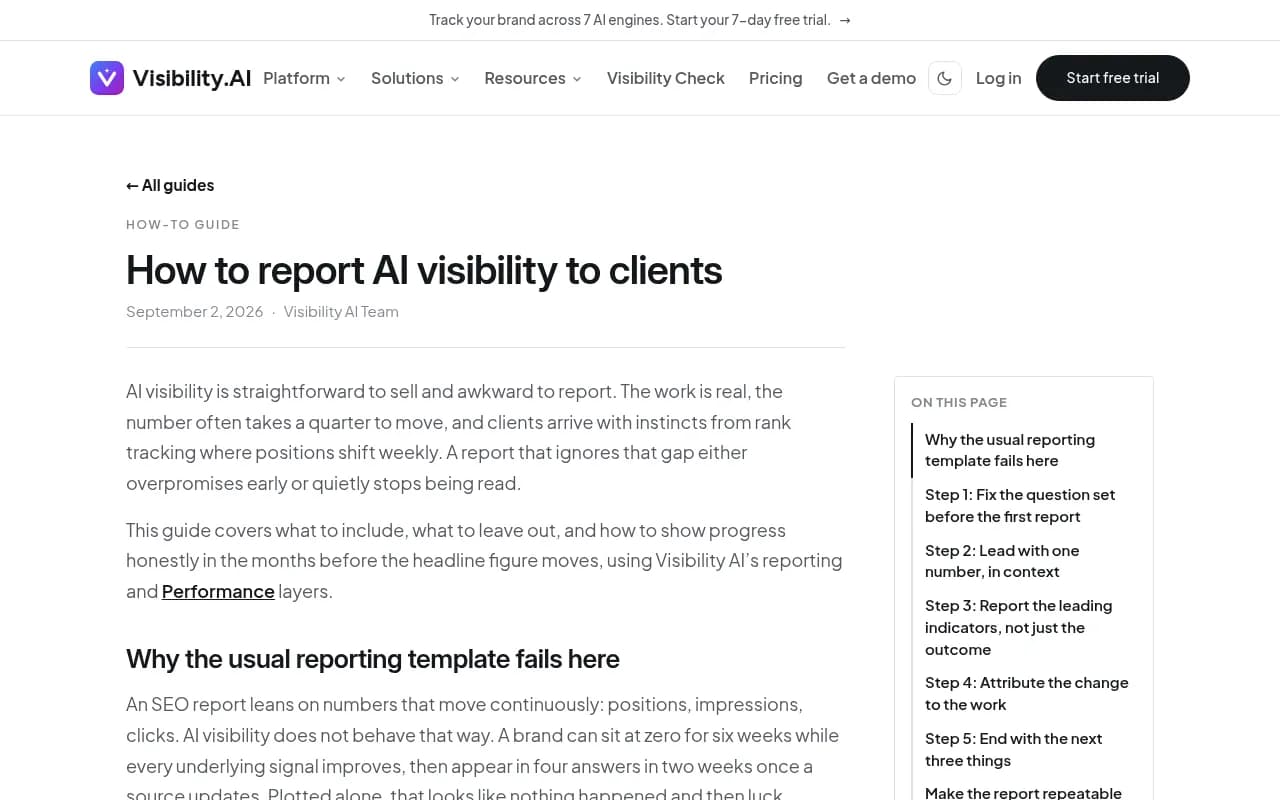
A few other reports on this topic make the same point from different angles. Visibility AI's client reporting guide argues that AI visibility is awkward to report because the headline number can sit flat for weeks while the underlying signals improve. That matches what I see. A flat line in month two is not failure, but you need evidence ready to prove it.
The structure: one report, two layers
Keep the whole thing to roughly three pages. Page one is for the CEO. Pages two and three are for engineering and whoever owns content.
| Section | Audience | Question it answers | Decision it supports |
|---|---|---|---|
| 1. Headline summary | CEO | Are we visible where buyers ask? | Keep, raise or cut investment |
| 2. Share of answers vs competitors | CEO, product | Who wins our category prompts? | Positioning, competitive response |
| 3. AI referral traffic and signups | CEO, growth | Does visibility create pipeline? | Budget justification |
| 4. Citation sources | Eng, content | Which pages and domains does AI cite? | What to write, update or fix |
| 5. Crawl and access health | Eng | Can AI bots read our docs? | Engineering tickets |
| 6. What AI says about us | Product, PMM | Is the description accurate? | Docs and messaging fixes |
| 7. Next three actions | Everyone | What happens this month? | Owners and deadlines |
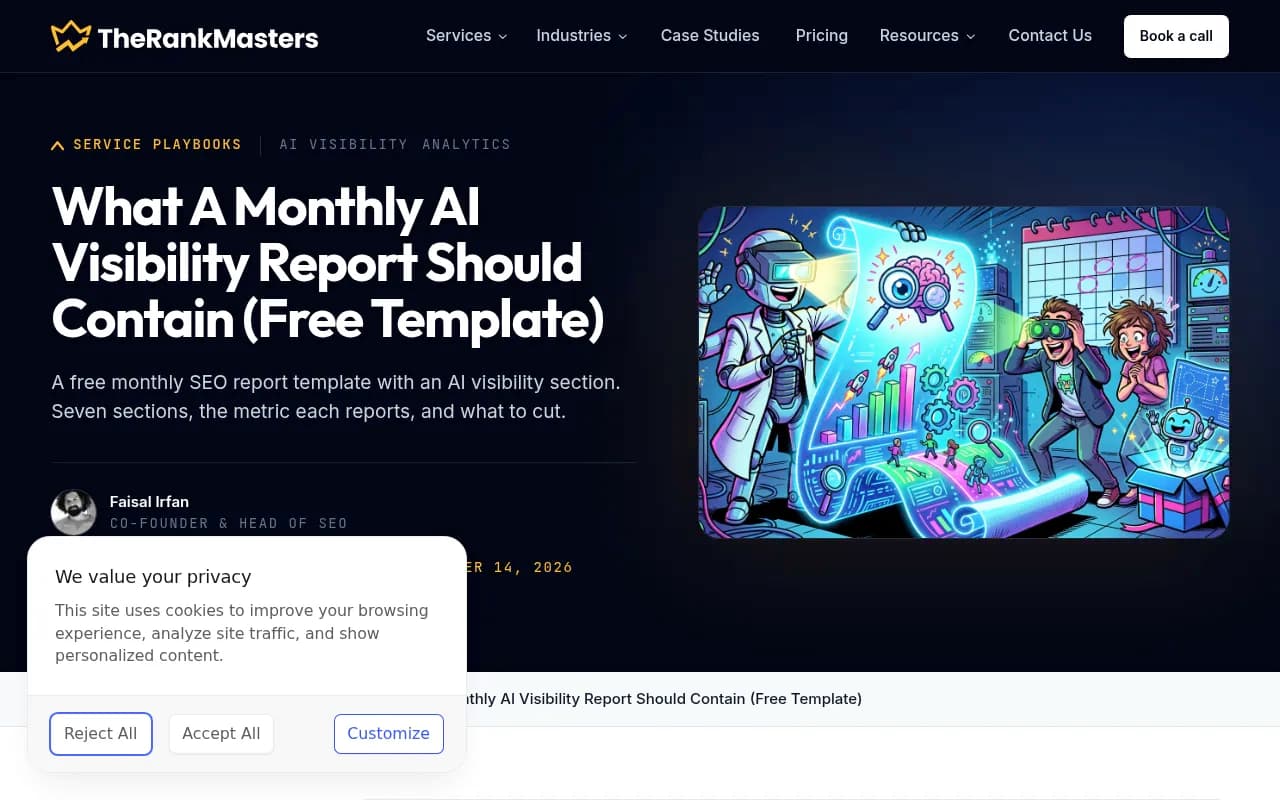
The Rank Masters template uses a similar order: a summary a leader can read in two minutes, then citations, share of answers, AI referral visits and competitor citations, each tied to the decision it supports. I would keep that principle and add the engineering layer on top.
Step 1: Fix the prompt set before the first report
Everything downstream depends on this step. Write down 40 to 100 prompts and freeze them. Group them like this:
- Category discovery, e.g. "best API monitoring tools for startups"
- Implementation, e.g. "how to add rate limiting to an Express API"
- Comparison, e.g. "Tool A vs Tool B"
- Branded, e.g. "is Tool A good for large teams"
- Troubleshooting, e.g. "Tool A webhook not firing"
Dev tool buyers lean heavily on implementation and troubleshooting prompts, so do not build a set made only of "best X" queries. Have an engineer on your team review the list. They will catch the questions your marketing team would never think to ask.
Why so many prompts? Promptwatch Data shows that almost half of ChatGPT responses cite 10 or more unique domains (47.6% in the Sep 28 to Oct 4, 2026 window), and organic prompts are the heaviest, with 52.5% citing 10 or more. See the unique domains per response report. Answers are wide and variable, so any single prompt tells you almost nothing. The report's own advice applies here: measure across many prompts, track where you appear in the answer, and track which competitors show up beside you.
Change the set quarterly, not monthly. When you do, record it in a changelog line and restate the prior month on the new set so the trend stays honest.
Step 2: Write the CEO summary
The CEO summary is six lines. Here is the template:
AI visibility summary, [Month 2026]

Headline: We appeared in X% of tracked category answers (last month Y%, 3-month avg Z%).
Competitive position: We rank #N of M tools by share of voice. [Competitor] leads at X%.
Pipeline: AI search sent N visits and M signups (last month N2 and M2).
What moved: [One sentence naming the work that caused the change.]
Risk: [One sentence, e.g. a model update, a lost citation source, an inaccurate claim.]
Ask or decision: [One thing you need from leadership, or "none".]
Three rules for this section.
First, one headline number, with context. Do not give the CEO six metrics. Give them visibility rate or Visibility Score, plus last month and a rolling average. Answers shift with phrasing and model updates, so a single-month dip can mean nothing. Context stops you spending the meeting explaining variance.
Second, name the cause. "Up 4 points after we rewrote the Python quickstart and the SDK README" is a sentence a CEO can act on. "Up 4 points" is not.
Third, state the risk even when it is boring. Model changes do happen. Promptwatch Data recorded average citations per ChatGPT response dropping across models around the GPT-5.3 rollout on March 4, 2026, and reddit.com's share of ChatGPT citations falling from about 4% to 0.5% on August 14, 2026. If either had hit your numbers in the month it happened, the CEO deserved a line explaining it was the platform, not the team.
Step 3: Report the leading indicators
The headline can take a quarter to move. In the meantime, give leadership evidence that the inputs are improving. For dev tools, the useful ones are:
- Number of tracked prompts where you are cited at least once, even if not recommended
- Citations to your own domain versus third-party domains (docs, GitHub, review sites)
- Pages newly cited this month
- AI crawler success rate on docs and key pages
- Accuracy of the claims AI makes about your product
On the source mix, look at what Promptwatch Data found for software prompts in the October 2026 ChatGPT software citation report (Sep 28 to Oct 4, 2026). GitHub was the most cited software domain at 1.2% of software citations, learn.microsoft.com followed at 0.98% and G2 at 0.73%. Grouped by source type, docs and help centers earned 2.64%, vendor sites 2.01%, review sites and analysts 1.57% and GitHub 1.2%. Vendor sites and docs together earned about three times what review sites and analysts did.
For a dev tool, that argues for a specific table in your report:
| Source type | Your cited pages this month | Last month | Notes |
|---|---|---|---|
| Docs and help center | Quickstarts, API reference | ||
| GitHub (README, repos, issues) | Public repos only | ||
| Vendor site (product, landing) | |||
| Review sites (G2, Capterra) | Profile completeness | ||
| Community and forums |
The same report's advice for developer tools is short: keep a public GitHub presence, keep docs crawlable, keep G2 and Capterra profiles complete. If your table shows zero cited GitHub pages while a competitor has three, you have found next month's engineering ticket.
Content type matters too. In Promptwatch's content type data (Sep 28 to Oct 4, 2026), product pages took 22.4% of classified ChatGPT citations and landing pages 16.8%, docs 7.5% and how-tos 8.7%. For informational prompts, docs reached 8.5%. News fades quickly: per the content half-life report, news lost half its cited pages within 36 days, while landing pages and docs held on far longer. If your launch posts are your only citations, expect them to disappear before the next report.
Step 4: The engineering appendix
This is the section engineering leads actually read. Keep it tied to tickets, not trends.
Crawl and access health
List which AI crawlers hit your docs and key pages, which got errors, and which pages they never reach. Typical findings: docs behind a client-side render, a robots.txt that blocks AI bots by accident, a CDN rule returning 403s, API reference pages missing from the sitemap. Each finding becomes a line item with an owner. Server logs work for this, and platforms with IP-verified crawler logs make it easier. You can also run the free Agentic Readiness Check to see which crawlers and agent standards your site supports.
Citation map by page
For your top 20 pages, report: cited yes or no, which prompts cite it, position in the source list, and whether a competitor page is cited instead. This turns "we are not visible" into "our webhook guide is not cited and the competitor's is, on 7 of 9 troubleshooting prompts."
Accuracy and narrative
Collect the specific claims AI makes about you: pricing, supported languages, limits, deprecated features. Mark each accurate or inaccurate, and link inaccurate claims to the page likely feeding them. In dev tools, stale docs are the most common cause. An AI that tells developers your SDK lacks Rust support because an old changelog said so is costing you real signups.
Technical hygiene
One line each on broken links, orphaned docs pages, missing sitemap entries and schema problems. Keep it short. The goal is to stop the appendix from becoming a technical SEO audit.
Step 5: Tie visibility to traffic and signups
CEOs will ask about revenue within two meetings. Report three numbers: AI referral visits, signups or trials from those visits, and the conversion rate compared with other channels. Use your analytics tool and add a note on attribution limits. Some AI products strip referrers, so a share of AI-driven visits arrives as direct traffic. Say so in the report instead of letting someone discover it later. Promptwatch's guide to attributing AI traffic covers the common workarounds, including UTM tagging.
Developer tools have one more wrinkle. Many developers go from an AI answer to a terminal, running npm install or pip install without ever visiting your site. Package download counts, GitHub stars and docs page views belong in this section as supporting evidence, labelled as correlated rather than attributed.
Step 6: End with the next three actions
Finish every report with exactly three actions. Not ten.
Next month
1. [Action] - Owner: [Name] - Due: [Date] - Expected effect: [Metric]
2. [Action] - Owner: [Name] - Due: [Date] - Expected effect: [Metric]
3. [Action] - Owner: [Name] - Due: [Date] - Expected effect: [Metric]
Then start the next report by checking whether those three shipped. Leaders stop reading reports that never mention what happened to last month's promises.
Tools that make the report repeatable
Building this by hand in a spreadsheet works for the first month or two. After that, the manual prompt runs and screenshotting become the reason reports slip. Here is how some of the tools in this category fit the dev tool template.
Promptwatch is the one I would look at first when the engineering appendix matters, because it covers tracking, the source and crawler side, and content in one place: prompt tracking across ChatGPT, Gemini, Perplexity, Claude and Google AI Overviews, IP-verified AI crawler logs, citation analysis, visitor analytics for AI-referred traffic, and an Action Board that produces the prioritized to-do list for your next three actions. It also tracks how coding agents like Codex, Claude Code and OpenCode recommend tools and docs, which is directly relevant if developers discover you inside their editor.
Other tracking tools worth a look for the headline and share-of-voice sections:

| Need in the template | What to look for | Example tools |
|---|---|---|
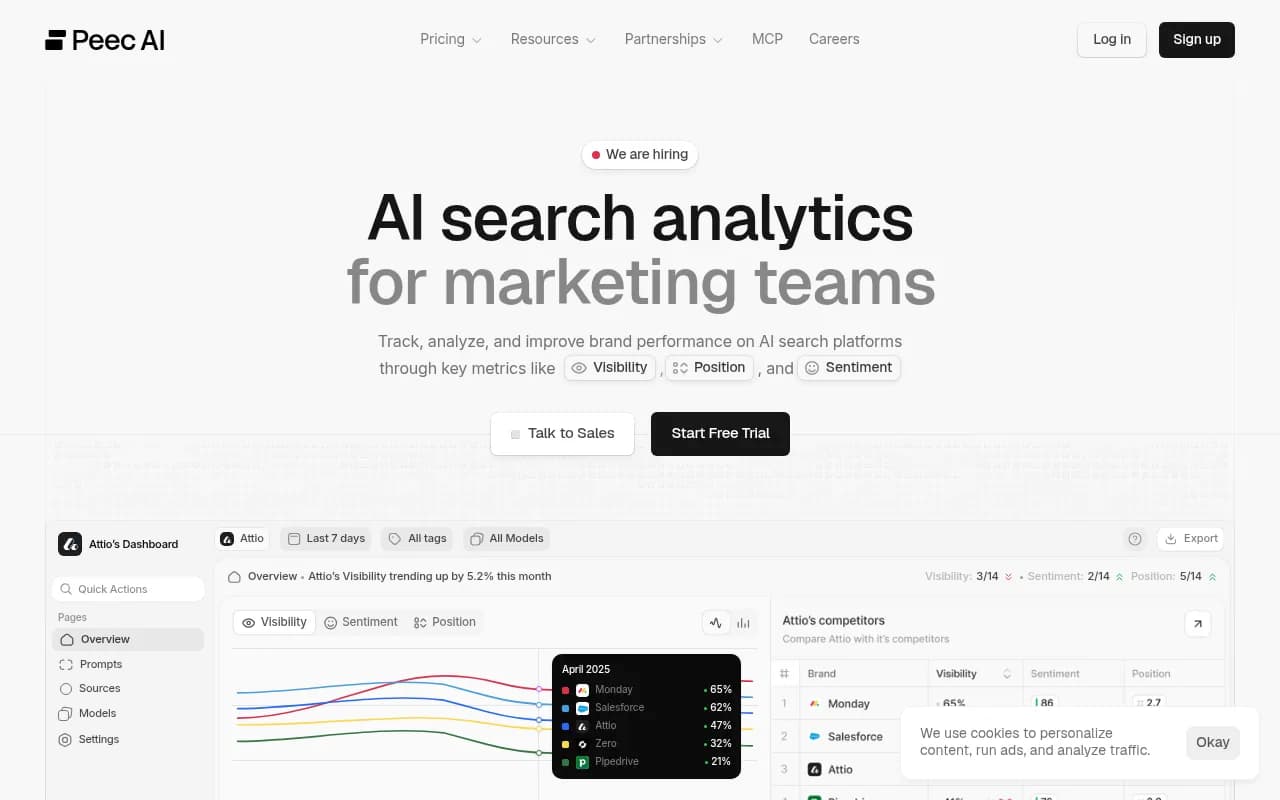
| Fixed prompt set across models | Daily runs, many prompts, country and language control | Promptwatch, Profound, Peec AI, Otterly.AI |
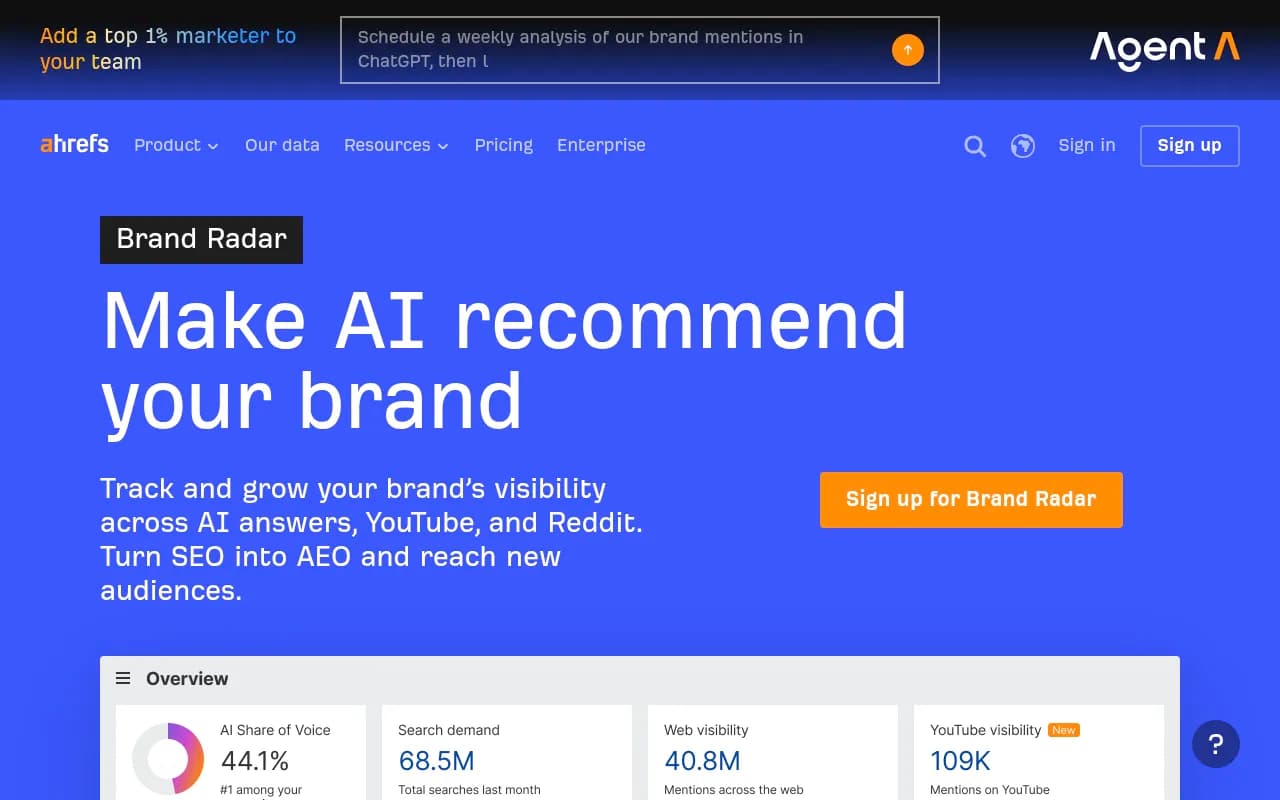
| Citation sources by domain and page | Source-level reporting, not just mentions | Promptwatch, Profound, Ahrefs Brand Radar |
| AI crawler access for docs | Server or CDN logs, not just prompt data | Promptwatch |
| AI referral traffic and signups | Visitor analytics or analytics integration | Promptwatch, GA4 |
| Scheduled PDF or dashboard for leadership | Exports, custom dashboards, Looker Studio | Promptwatch, Semrush |
| Coding agent recommendations | Tracking of Codex, Claude Code and similar | Promptwatch |
For a longer list of options, the GEO software directory at bestgeosoftware.com is a reasonable place to compare more tools.
A reusable one-page template
Copy this into a doc and fill it in monthly.
AI VISIBILITY REPORT - [Product] - [Month 2026]

1. SUMMARY (CEO)
   Headline metric: ___ (prev ___, 3-mo avg ___)
   Share of voice rank: #__ of __
   AI visits / signups: ___ / ___
   What moved and why: ___
   Risk: ___
   Decision needed: ___

2. COMPETITORS
   Top 3 competitors by share of voice, change vs last month
   Prompts where we lost position, prompts where we gained

3. SOURCES
   Table: docs / GitHub / vendor / review sites / community
   Newly cited pages, lost citations

4. ENGINEERING APPENDIX
   Crawl errors and blocked bots
   Top 20 pages: cited y/n, by which prompts
   Inaccurate claims and the pages likely causing them
   Technical hygiene (3 lines max)

5. PROMPT SET
   Count: __ | Changes this month: none / list

6. NEXT THREE ACTIONS
   Action / owner / due date / expected metric
Common mistakes
- Changing the prompt set every month, then explaining a trend that is just a different question list.
- Reporting mentions without position or sentiment. Being listed fifth in an answer is not the same as being recommended first.
- Giving engineering a marketing dashboard. They want URLs, status codes and tickets.
- Hiding the flat months. A report that only appears when numbers are up loses trust fast.
- Reporting a single-engine dip as a regression. Check across models and across the rolling average first.
Monthly is the right cadence for leadership. Semrush's reporting guide makes the same call, since it matches how analytics data refreshes and how most leadership cycles already run. Keep a lighter weekly check for engineering if you are mid-fix, but do not push weekly numbers to the CEO.
The short version
Freeze your prompt set, lead with one number and its context, show leading indicators while the headline catches up, and give engineering a page-level appendix they can turn into tickets. Close with three actions and owners. If you can send that report in under an hour each month, you have the process right.