Key takeaways
- Franchise owners care about their own location, so report location by location. A brand-level average hides the weak units that are quietly losing customers.
- Lead with two simple percentages per market: how often AI recommends the location, and how often the Google 3-pack shows it. Re-run them monthly and treat the series as your baseline.
- AI visibility is much harder to earn than 3-pack visibility. SOCi's 2026 Local Visibility Index (350,000+ locations) found ChatGPT recommends 1.2% of locations while the 3-pack surfaces 35.9%.
- Every section of the report should end in an action and an owner, either the brand team or the franchisee.
- One page for the owner, a deeper appendix for the brand team. Nobody reads a 30-page PDF.
Why franchise owners need a different report
An ordinary SEO report is written for a marketing manager who cares about the whole brand. A franchise owner is a different reader. They run one unit, maybe three. They know their own street, their own competitors and their own phone calls. If your report opens with a brand-wide visibility score, they will scan for their own city, not find it, and close the file.
Lindsey at LinzEO calls this spread the location gap: two units share a logo and a website template, and the map results look nothing alike. A brand-level ranking report averages it away. A location-by-location view shows where the system is losing customers. That is the whole argument for the template below.
The second reason is that the numbers are low and new. Franchise owners have spent years learning what a 3-pack ranking means. They have no feel for what "visible in ChatGPT" means, so the report has to teach it in one line and then keep the format stable so the trend makes sense.
The one-page owner report: structure
The Blueprint Training's monthly SEO report guide makes a point that applies here too: an SEO report has one job, which is to show that the work is turning into customers. Rankings and traffic are evidence, not the result. For a franchise owner, the result is calls, direction requests, bookings and walk-ins.
Here is the page I would send each owner, in reading order.
| Section | What it shows | Who acts on it |
|---|---|---|
| 1. Summary | Three sentences: what changed, why, what happens next | Brand team writes |
| 2. Customer outcomes | Calls, direction requests, website clicks from Google Business Profile, plus AI-referred visits | Owner reviews |
| 3. Local visibility | Google 3-pack presence for the top 3 queries in the owner's market | Brand team |
| 4. AI visibility | % of tracked prompts where the location is recommended, by engine | Brand team |
| 5. Competitors | Who gets recommended instead, in this market | Both |
| 6. Sources | Which sites the AI cited when it named a competitor | Brand team |
| 7. Reviews and profile | Rating, review count, response rate, profile completeness | Owner acts |
| 8. Next month | Two or three actions with names next to them | Both |
Keep it to one page. Everything else goes in an appendix for the brand team.
Section 1: the summary paragraph
Write it last, put it first. Three sentences is enough. Say what moved, say the likely reason, say what you are doing about it.
A decent example: "Your location was recommended in 3 of 20 tracked prompts this month, up from 1 of 20. The gain came after the new location page went live with your service area and hours. Next month we are fixing three listings that show an old phone number."
No adjectives, no "exciting momentum." If nothing changed, say that and say why. Owners trust a report that admits a flat month.
Section 2: outcomes before visibility
Put customer actions right under the summary. Calls, direction requests, bookings and form fills from Google Business Profile and the location page. If you can attribute visits from AI assistants, show those as their own line.
That last line is worth the effort. Digital Elevator cites figures claiming AI-referred traffic converts at 6.24% versus 3.29% for organic. I would treat that as a secondary claim, since the underlying source was not checked here, but the direction matches what many teams see: AI visitors arrive further along. Show your own conversion rate for AI visits next to organic and let the owner see the real difference in their market.
One caution. ChatGPT stopped sending a referrer on October 8, 2026, so AI traffic is now undercounted unless you tag links. If you run a tool that supports a UTM-based setting for ChatGPT visits, turn it on, and note in the report that the number is a floor, not a total.
Section 3 and 4: the two percentages
The Happy Cog franchise field guide gives the cleanest advice I have seen on this: report two percentages by market, re-run monthly, and treat the series as your baseline. It is the first AI-visibility number a franchisee will understand.
The two numbers:
- 3-pack presence: out of your top three commercial queries, in what share of them does the location appear in Google's local 3-pack?
- AI recommendation rate: out of your tracked prompts, in what share of AI answers is the location named?
Show them side by side, per location, per month, as a small table or a two-line chart. Do not blend them into a single "visibility score." The gap between the two numbers is the story.
Set expectations with benchmarks
Owners will ask whether 8% is good. SOCi's local visibility benchmarks for franchises give a frame of reference:
| Metric | Retail | Restaurants | Financial services |
|---|---|---|---|
| Google 3-pack presence | 49.5% | 24.3% | 44.0% |
| ChatGPT recommended | 10.2% | 5.3% | 3.1% |
| Gemini recommended | 18.3% | 7.1% | 16.4% |
| Perplexity recommended | 16.2% | 7.6% | 9.9% |
| Google profile completeness | 86.4% | 94.2% | 81.4% |
These are category averages for franchise brands, so they tell an owner whether they are ahead of or behind a typical peer. They do not tell the owner what is achievable in a specific town. Label them as a reference line, not a target.
Also note how much engines differ. A location can be at 5% in ChatGPT and 15% in Gemini. Report per engine, not blended, or you will lose the diagnosis.
Read the numbers against citation slots
Engines show different numbers of sources, and that changes how you read "cited in X% of answers." Promptwatch's data on average sources per response shows ChatGPT cites roughly 5 sources per web-search answer, while Google AI Overviews cites about 10 and Perplexity almost exactly 10 every day. Copilot swings widely, so judge it on monthly trends. You can see the detail in Promptwatch Data on average sources per response.
Practical implication: five slots in ChatGPT means more competition per slot. A location appearing in 6% of ChatGPT answers and 12% of AI Overviews answers is not necessarily doing better in one than the other.
Section 5: competitors in the owner's market
Owners think in terms of the shop down the road. List the three businesses AI recommends most often in their market for the tracked prompts, with how often each is named. If the answer is a direct competitor franchise, say so. If it is a directory or marketplace, say that too.
This section is the one owners actually screenshot and send to their spouse. Keep the names real.
Section 6: the sources behind the answers
This is the section brand teams skip and then regret. When an AI engine names a competitor, it cites pages. Show which ones. Typically you will find a mix of directories, review sites, the competitor's own location page and news or social posts.
Social sources deserve a note, because they differ sharply by engine. Promptwatch Data's Social Media Citations in AI Search report for November 2026 (Oct 11 to Nov 9, 2026) found social platforms made up 13.16% of citations in Google AI Overviews, 1.94% in Perplexity and 0.64% in ChatGPT. Inside AI Overviews, YouTube led at 6.71% and Facebook followed at 2.34%. In Perplexity, Reddit (0.82%) and LinkedIn (0.66%) led.
For a franchise, that means a well-kept Facebook page and local videos can matter for AI Overviews, while for ChatGPT the report's advice is to focus on your own site and the guides, listicles and comparisons it cites. Report the source mix for each engine and let it decide where the owner's time goes. Note the caveat when comparing to older data: the earlier October report covered 7 days, the November one covers 30.
Section 7: reviews and profile health
This is where the owner has real control. Show rating, review count, response rate and profile completeness. Google names relevance, distance and prominence as its local ranking factors in its own help documentation. Distance belongs to the searcher. Relevance and prominence get built one location at a time, which is why reviews and complete profiles sit on the owner's side of the ledger.
Give a short checklist of what the owner can do this month: respond to unanswered reviews, upload fresh photos, confirm hours, add services. Three items, not twelve.
Section 8: next month's actions
Every report ends with two or three actions, each with a name. A simple split works well:
| Task | Brand team | Franchise owner |
|---|---|---|
| Reporting | Tracks results by location | Reviews results and acts |
| Location pages and schema | Builds and maintains | Supplies local details |
| Listings and citations | Audits and fixes | Confirms accuracy |
| Reviews | Sets the process and templates | Asks and responds |
That division comes from the multi-location guide at SeeSparkGo, and it is a good default. If an action has no name next to it, it will not happen.
The brand-team appendix
Behind the one-pager, keep a fuller view for the system level:
- A ranked list of all locations by AI recommendation rate and 3-pack presence, grouped into tiers
- A heatmap of locations by engine
- The location gap: best versus worst unit, and the median
- Crawler access and page health for location pages
- Notes on anything that changed: a profile edit, a new page, a listing correction, an algorithm update
Digital Elevator suggests tiering every location after an audit that scores both AI and traditional local visibility. It is a sensible way to decide where to spend the month: Tier 1 units get protected, Tier 3 units get the attention.
A warning on location pages. Digital Elevator reports that Google's March 2026 scaled content enforcement cut organic traffic 30 to 60% on programmatically generated location pages. I did not verify that figure independently, but the lesson holds: swapping the city name into a template is not a local page. Your appendix should flag any location page that looks templated.
Tools to collect the data
You have two jobs: pull local data per location, and track AI answers per location. Few tools do both well, so most franchise teams combine two.
AI answer tracking
For tracking what AI engines say about each market, Promptwatch monitors the real interfaces of ChatGPT, Google AI Overviews, Google AI Mode, Gemini, Perplexity and others. On Business and Enterprise plans, local GEO/SEO targeting lets you pin a monitor to exact coordinates so answers come back as if asked from that spot, and state and city tracking is included. That fits "near me" prompts for individual franchise units. Its crawler logs and visitor analytics also help with the outcomes section. Check Promptwatch pricing for current plans.
Local listings and franchise suites
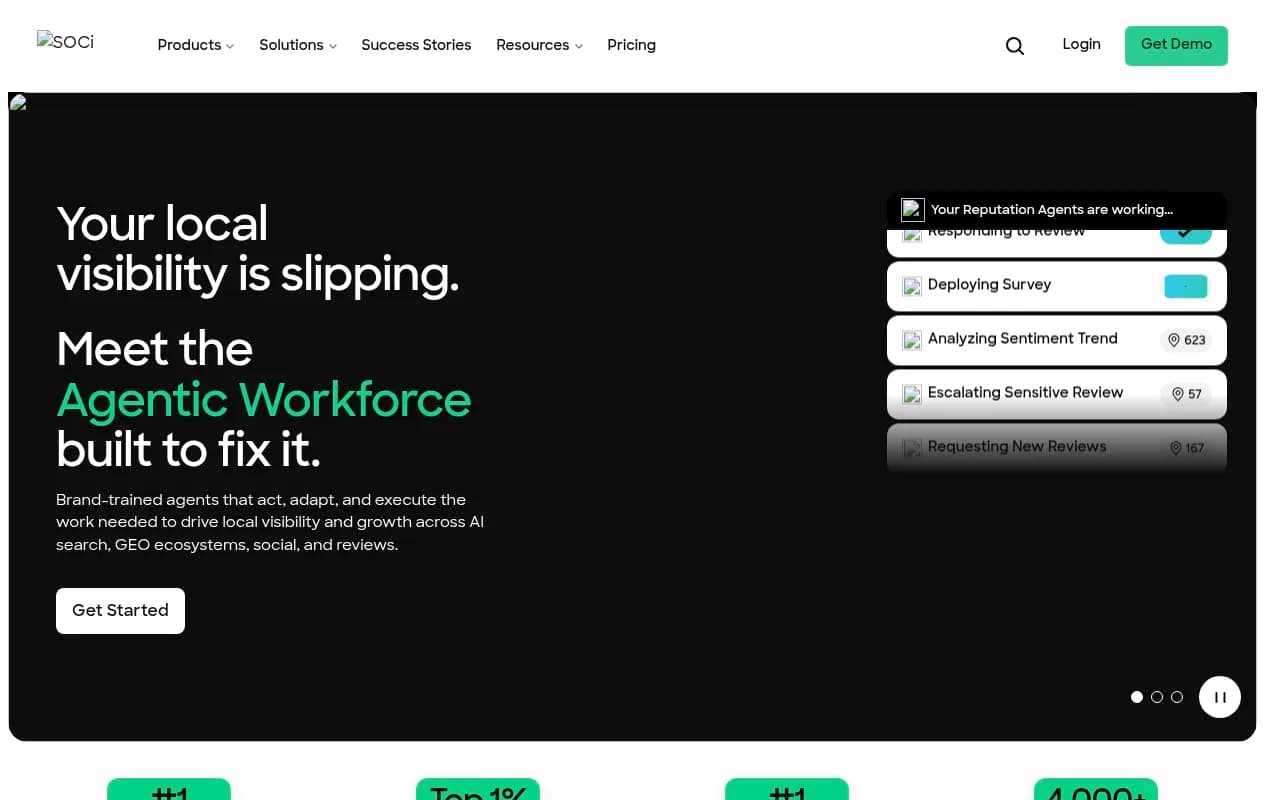
SOCi is a multi-location platform for local search, reviews and social, and it is the source of the benchmark data above.
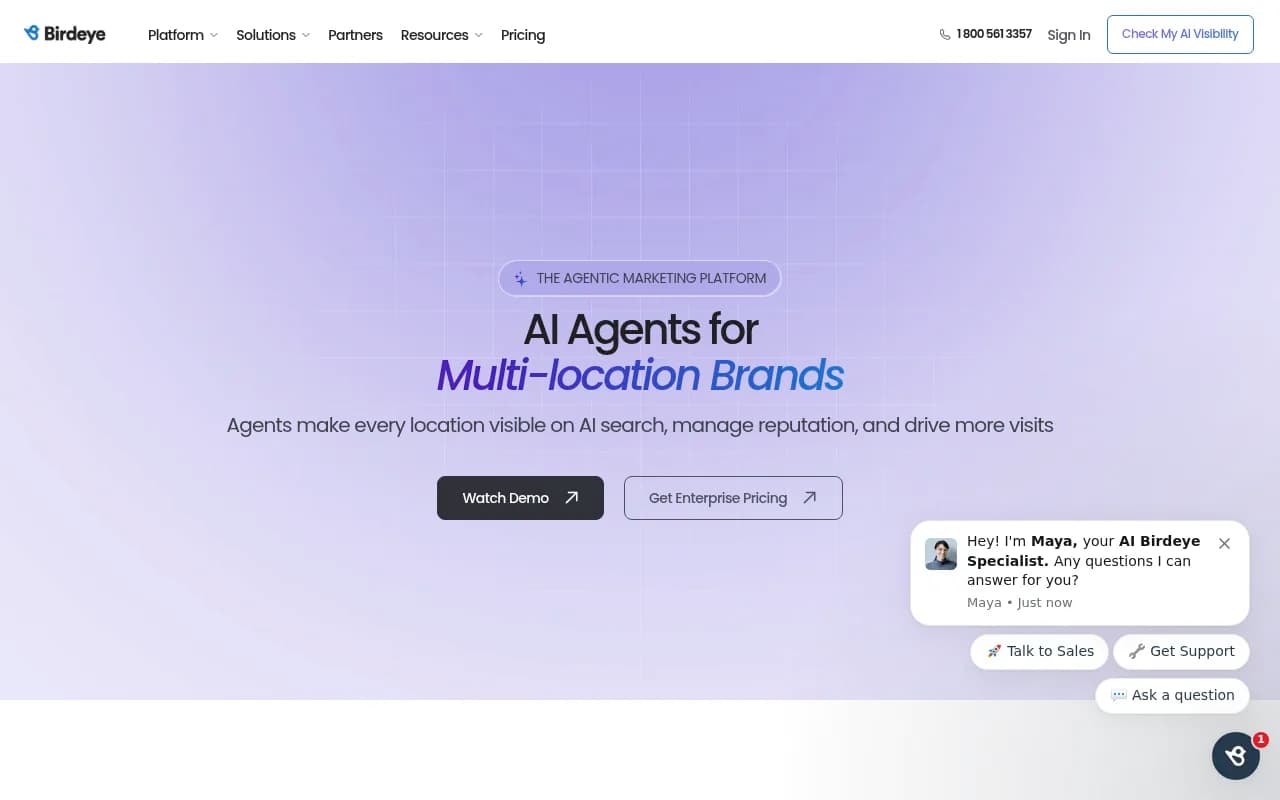
Birdeye Search AI focuses on location-level AI visibility tracking.
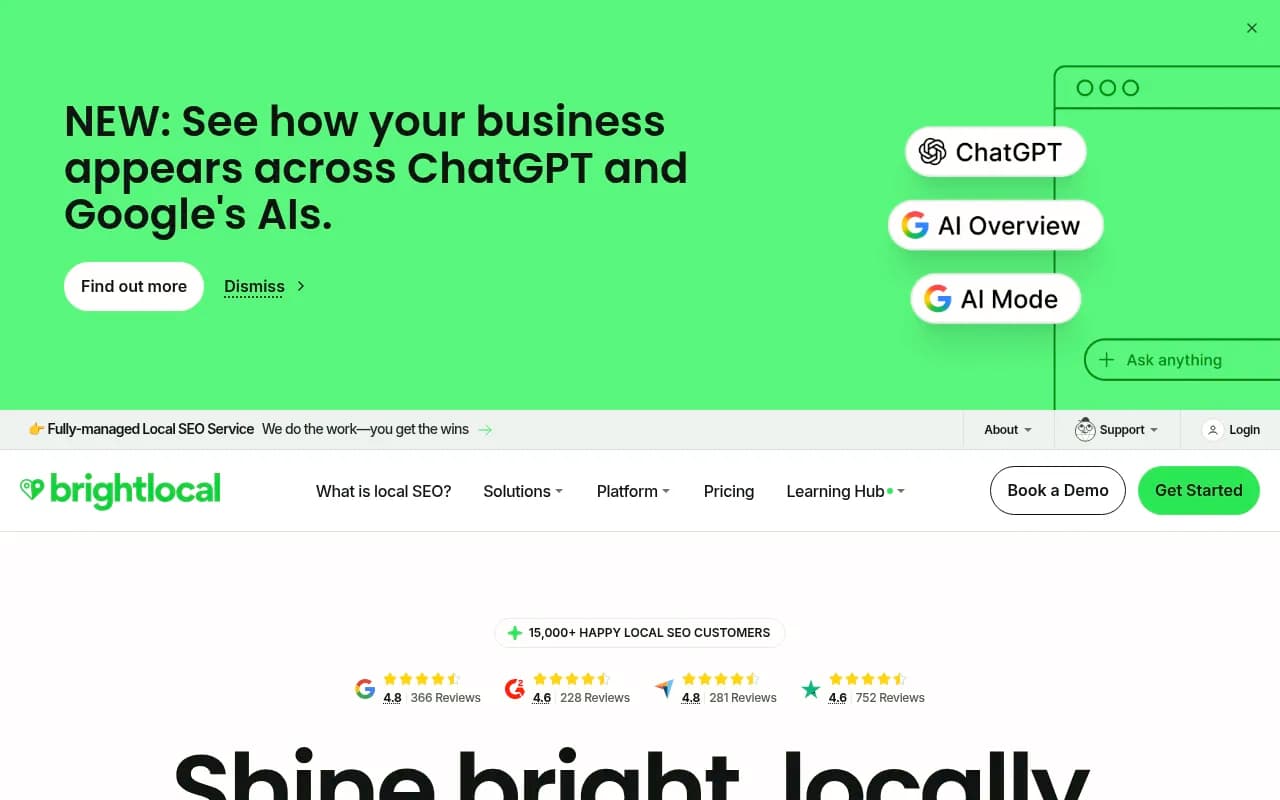
BrightLocal covers local rankings, listings and reviews and has added AI visibility.
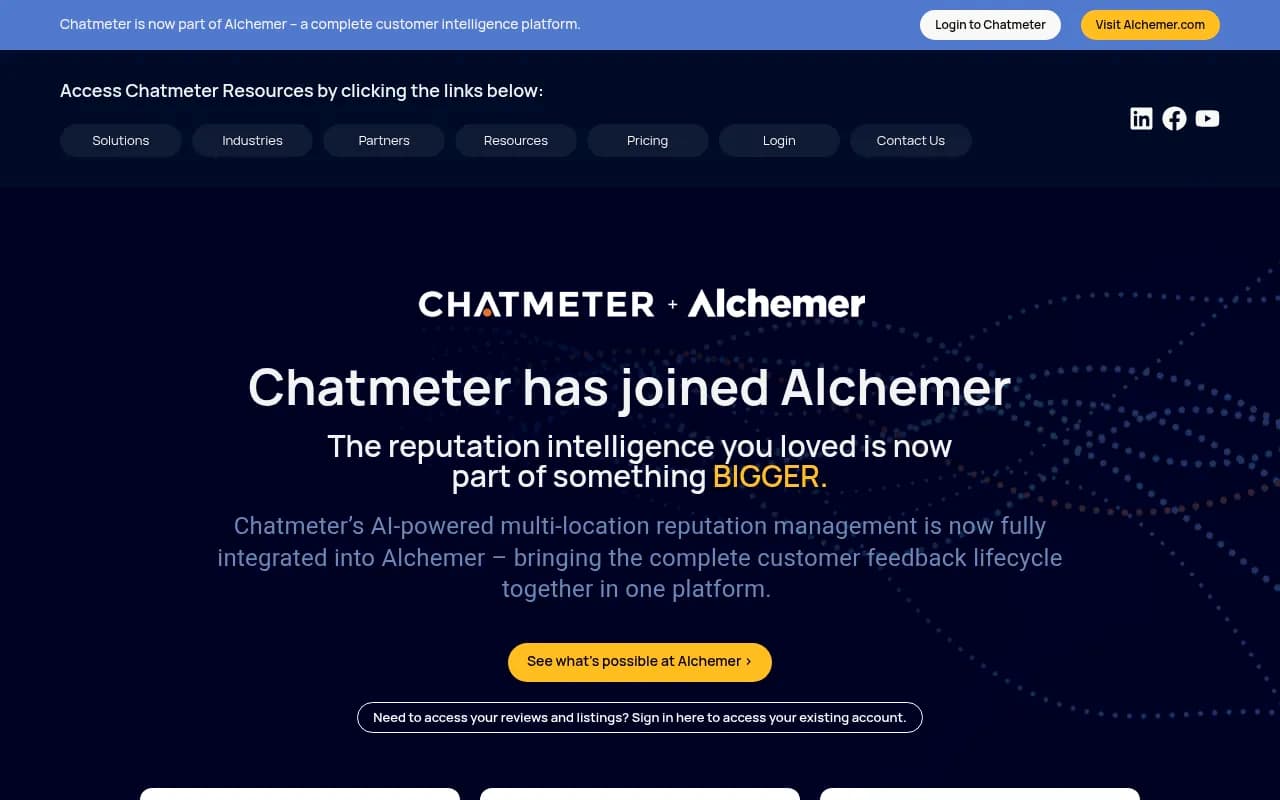
Chatmeter and Yext both handle listings and reviews at scale.
| Tool | Strength | Use in the report |
|---|---|---|
| Promptwatch | AI answer tracking with exact-coordinate local targeting, crawler logs, visitor analytics | Sections 4, 5, 6 and AI-referred traffic |
| SOCi | Multi-location local search, reviews and social | Sections 3 and 7, benchmarks |
| Birdeye Search AI | Location-level AI visibility | Section 4 |
| BrightLocal | Local rankings, listings, reviews | Sections 3 and 7 |
| Chatmeter | Reviews, listings, local pages | Section 7 |
| Yext | Verified listing data across channels | Listing accuracy checks |
I have not compared pricing across these, so confirm with each vendor. If you are shopping the category, the GEO software directory at bestgeosoftware.com is a reasonable place to scan the options.
Delivery: cadence and format
Send the one-pager monthly, on the same day. A written summary with the numbers beats a login to a dashboard that owners will not open. Offer a short call only to owners with a flagged problem. Keep the format identical every month, since the point of the baseline is comparison.
Some agencies prefer to outsource this reporting. If you want a partner to run it, 1001 SEO Media works on local SEO and AI search visibility with transparent monthly reporting. Otherwise, a brand team with one analyst can run this template on its own.
Common mistakes
- Reporting the brand average. Always show the location, then the system.
- Blending engines into one score. Show ChatGPT, Gemini, Perplexity and AI Overviews separately.
- Changing prompts every month. Fix a prompt set for each market and only add, never swap, or the trend breaks.
- Judging on a weekly snapshot. AI answers vary day to day. Use monthly trends.
- Burying actions at the bottom. Put them in the summary too.
- Presenting low numbers without context. A 4% ChatGPT rate looks bad until the owner sees the category benchmark.
A starter checklist
- Choose 10 to 20 prompts per market, including "near me" variants and a few branded ones.
- Run them across at least ChatGPT, Gemini, Perplexity and Google AI Overviews.
- Record 3-pack presence for the top three commercial queries.
- Log the recommendation rate per engine and the competitors named.
- Pull calls, directions and website clicks from Google Business Profile.
- Write the three-sentence summary and two or three named actions.
- Send it on the same day each month, then repeat.
The first report will have thin numbers, and that is fine. By month three, the owner has a trend line, you have a list of what moved it, and the conversation shifts from "what is AI visibility" to "what do we fix this month." That shift is the whole point.