Key takeaways
- Visibility Score tells you how present you are. Share of Voice tells you how present you are compared with competitors. Position tells you how prominent you are when you do appear.
- Low Share of Voice is a coverage problem. Late Position is a prominence problem. Mentions without citations to your own domain are a content or crawlability problem. Weak sentiment is a reputation problem.
- Many tools report presence rate and label it Share of Voice. Check the formula before you trust the number.
- Crowded answers make presence scores look healthier than they are. Promptwatch Data found 47.6% of ChatGPT responses cite 10 or more domains (Sep 28 to Oct 4, 2026).
- Always segment by AI model, prompt type (organic vs brand-specific), country and competitor set. A blended average hides the problem you are trying to find.
Why one number is never enough
Most teams open an AI visibility dashboard, see a single score, and either celebrate or panic. Neither reaction tells them what to do on Monday.
The trouble is that three different questions are hiding inside "how are we doing in AI search?":
- Do the models mention us at all?
- Do they mention us more than they mention the competition?
- When they mention us, are we the first name in the answer or the fifth?
Visibility Score, Share of Voice and Position answer those three questions respectively. Read separately, each one can mislead you. Read together, they work like a triage chart: the pattern across the three points to the likely fix.
This guide defines each metric, shows how it commonly gets miscalculated, and then maps combinations of readings to specific problems.
The three metrics in plain terms
AI Visibility Score
Definitions vary by vendor, and that is the first thing to be careful about. Some tools define Visibility Score as the percentage of tracked prompts where your brand appears. Cognizo's guide gives the example of 60 appearances across 200 prompts, a score of 30%. Others, like OptimizeGEO, describe it as a composite from 0 to 100 that blends citation frequency, sentiment, share of voice and cross-platform consistency. Rankscale treats it as the headline 0 to 100 score for a prompt group.
In Promptwatch, Visibility Score runs from 0 to 100 and scores every response on placement, share of attention and depth, then averages the results. Responses that never mention your brand count as zero. So it is not a pure presence rate: a brand that appears late and briefly scores lower than one that leads the answer.
The practical rule: before you compare scores across tools or against a competitor's published number, find out whether the score is a rate, a composite, or a weighted average. They are not interchangeable.
What it is good for: a headline trend line and a quick check of whether you are gaining or losing ground over time. What it is bad for: explaining why.
Share of Voice
Share of Voice (SoV) is relative. It is your slice of all brand mentions in a prompt set, compared with a defined competitor group. The clean formula is:
AI SoV = your brand mentions / all brand mentions across all responses
A Visibility Score of 30% reads very differently when the category leader sits at 60% than when the leader sits at 15%. SoV is the metric that captures that difference. See the Promptwatch Academy page on Share of Voice for how it is counted there (one mention per response per brand).
One trap deserves its own warning. Waikay's guide points out that many tools report a presence rate and call it share of voice. If your brand appears in 30 of 100 prompts, that is a 30% presence rate. But if four other brands appeared in each of those same 30 responses, your real share is closer to 6%. Same raw data, very different story.
Position
Position is where your brand lands in the order of brands within an answer. Lower is better. If you are first in 6 answers and third in 4, your average position is 1.8 in the simple example from Unusual's metrics guide. Rankscale buckets it as #1 to 3 strong, #4 to 6 mid, #7 and beyond weak.
Position matters because AI answers are read top-down, and many users stop after the first recommendation. Being named is the entry ticket. Being named first is where the click or the shortlist spot actually happens.
Quick comparison
| Metric | Question it answers | Absolute or relative | Typical failure mode |
|---|---|---|---|
| Visibility Score | How often and how well do AI answers feature us? | Absolute | Looks healthy in a weak category, hides competitor strength |
| Share of Voice | How much of the conversation do we own versus rivals? | Relative | Presence rate reported as SoV, competitor set too narrow |
| Position | When we appear, how early are we named? | Per-mention | Averages hide a mix of first and last mentions |
| Citation share / rate | Do models point at our own pages as sources? | Source-level | Mentions without links back to you |
| Sentiment | How favorably are we described? | Qualitative | Scored separately, so a high-visibility brand can still be described badly |
Reading the three together: the diagnosis table
This is the part that makes the metrics useful. Here are the common combinations and what they usually mean.
| Visibility | Share of Voice | Position | Likely problem | First thing to check |
|---|---|---|---|---|
| Low | Low | n/a (rarely appear) | Coverage. Models do not associate you with the category | Content gap analysis: which prompts have no page of yours that answers them |
| Moderate | Low | Late | Crowded answers, you are a footnote | Which competitors are in the same responses, and which sources are cited for them |
| Moderate | Moderate | Late | Prominence. You are on the shortlist but not leading it | Comparison and listicle pages, third-party reviews that rank you lower |
| High | Low | Mid | Presence inflated by easy or branded prompts | Split branded vs non-branded prompts |
| High | High | Early | Healthy. Watch sentiment and citations | Sentiment and Brand Narrative claims |
| High | High | Early, but few citations to your site | Models know you from third parties | Crawler access and which of your pages get cited |
| Strong everywhere on one model, weak on another | Model-specific sourcing gap | Per-model breakdown and what each model cites |
Promptwatch frames it the same way: low Share of Voice is a coverage problem, late Position a prominence problem, mentions without self-citations a content or crawlability problem, and weak sentiment a reputation problem. The same logic shows up in Unusual's guidance that share, position and citation rate mostly point at visibility and missing proof, while recommendation quality points at positioning.
Problem 1: you are invisible (coverage)
Symptoms: low Visibility Score, low Share of Voice, and the Position number is based on a tiny sample so it is not telling you much.
This usually means the models do not connect your brand with the topic. Waikay says it plainly: if the score is lower than expected, the most likely cause is missing topical associations.
What to do:
- Map your pages against the prompts AI answers and find prompts where nothing on your site fits. Promptwatch calls this content gap analysis.
- Look at the query fan-outs. These are the web searches the model actually runs behind a response. If the model runs searches your site never answers, you are not in the retrieval set. Query fan-outs are explained here.
- Check whether AI crawlers can read your site at all. A coverage problem that is really an access problem gets fixed in an afternoon, while a content problem takes weeks. IP-verified AI crawler logs show which bots hit which pages and where they fail.
Problem 2: you appear but you are drowned out (share)
Symptoms: reasonable Visibility Score, weak Share of Voice.
This is the crowded-answer problem, and it is more common than it used to be. According to Promptwatch Data on unique domains per ChatGPT response (Sep 28 to Oct 4, 2026), 47.6% of ChatGPT responses cite 10 or more different domains, and 66.1% cite at least 8. For organic prompts, the ones where no brand is named, 52.5% cite 10 or more.
In an answer like that, many brands share the space. A presence-style score can look fine while your share of the conversation stays small.
A caution on older numbers: Promptwatch's average sources per response report, dated September 2025, put ChatGPT at roughly 5 sources per web-search answer. The October 2026 data is newer and is the better guide today. The gap likely reflects a change in model behavior or methodology, though I have not confirmed the cause.
What to do:
- Check which competitors show up in the same responses as you. That tells you who you actually split the answer with.
- Earn mentions on the third-party listicles, reviews and forums that the models cite for your category. Promptwatch Data on content types shows product pages as the most cited type in ChatGPT (22.4% of citations in that same week), followed by landing pages and listicles.
- Track brand-specific prompts separately. Those answers are narrower: only 21.3% cite 10 or more domains, and 5 is the most common count. Mixing them with organic prompts inflates your numbers.
Problem 3: you are on the list but not at the top (prominence)
Symptoms: decent Share of Voice, but Position is mid or late.
This is the gap between being mentioned and being recommended. The models know you exist. They just do not rank you first when they list options.
Typical causes:
- Third-party comparison articles rank competitors above you, and the model mirrors that order.
- Your own pages state your strengths vaguely, so the model has nothing concrete to lead with.
- A single competitor owns a specific attribute (cheapest, most integrations) and the model uses that as the sorting logic.
Position alone will not tell you which of those it is. Pair it with Brand Narrative style data, the individual claims AI makes about you and your rivals, grouped by theme like pricing, features or support. If the model keeps saying "expensive for small teams," that explains why you are named fourth.
Problem 4: you are named, but not for the right reasons (quality)
Symptoms: all three metrics look fine, yet leads from AI traffic are poor or the sales team hears odd descriptions of the product.
Unusual's guidance covers this well: you can be mentioned but mispositioned, where the AI places you in the wrong category or recommends you for the wrong buyer. Waikay makes a related point: a healthy score can come from appearing often for the wrong topics, because frequency across irrelevant queries inflates the number without producing useful visibility.
The fix is segmentation. Break the metrics out by topic, by persona and by funnel stage. A brand that dominates awareness prompts and vanishes on comparison and purchase prompts has a very different problem from the reverse. Prompting like your real buyers, with personas, catches the case where the general-audience average looks fine but your target persona sees something else.
Four mistakes that corrupt all three metrics
- Blending models. A brand can be strong in ChatGPT and weak in Perplexity on the same prompts. Report per model.
- Blending prompt types. Branded prompts almost always make you look good. Report organic, brand-specific and competitor-comparison prompts separately.
- Ignoring locale. Answers vary by country and language. Keep markets separate.
- A moving competitor set. If you add or drop competitors mid-quarter, Share of Voice changes without anything real happening. Fix the set and write it down.
Also fix the unit before you start: the prompt set, the AI system, the locale, the competitor set and the time window. Unusual lists those five as the basics, and I agree with that list more than most of the advice out there.
One more consideration is sampling. A single prompt tells you very little because answers vary run to run. Promptwatch's own recommendation from the unique-domains report is to measure across many organic prompts rather than reading anything into one.
A simple weekly triage routine
You do not need a complicated process. Try this:
- Look at Visibility Score per model. Note any model that moved more than a few points.
- Check Share of Voice against your top three competitors on non-branded prompts. Rankscale suggests this as the competitive read, with Detection Rate first for branded hygiene.
- Check average Position and how many answers you lead.
- Circle the weakest of the three. That is this week's problem.
- Open the citations behind it. For coverage, look for missing pages. For share, look for the sources competitors get that you do not. For position, look at what the top-ranked sources say about you.
- Make one change, and then check whether the metric moved. Page-level tracking helps here, since you can watch whether a specific URL starts getting crawled and cited.
Which tools can calculate these metrics
Nearly every AI visibility platform reports some version of the three. The differences are in definitions, data collection and what you can do after the number appears. Things worth checking before you buy:
- Does it collect from the real user interfaces of the AI products, or only from APIs? User-facing answers and citations can differ from API output.
- Is Share of Voice a true ratio of mentions, or a relabeled presence rate?
- Can you split by model, country, prompt type and persona?
- Does it connect the metric to a cause, such as crawler logs, citations and content gaps, or does it stop at the dashboard?
| Tool | Notes on the metrics |
|---|---|
| Promptwatch | Visibility Score, Share of Voice, Position, Sentiment, citation rank and self-citation rate, plus crawler logs and content gap analysis to act on them |
| Rankscale | Seven core metrics per AI engine, including Visibility Score, Position, Detection Rate and Share of Voice |
| Waikay | Strong published explanation of the share-of-voice ratio and its common mistakes |
| Semrush AI Visibility Toolkit | AI share of voice inside an existing SEO suite |
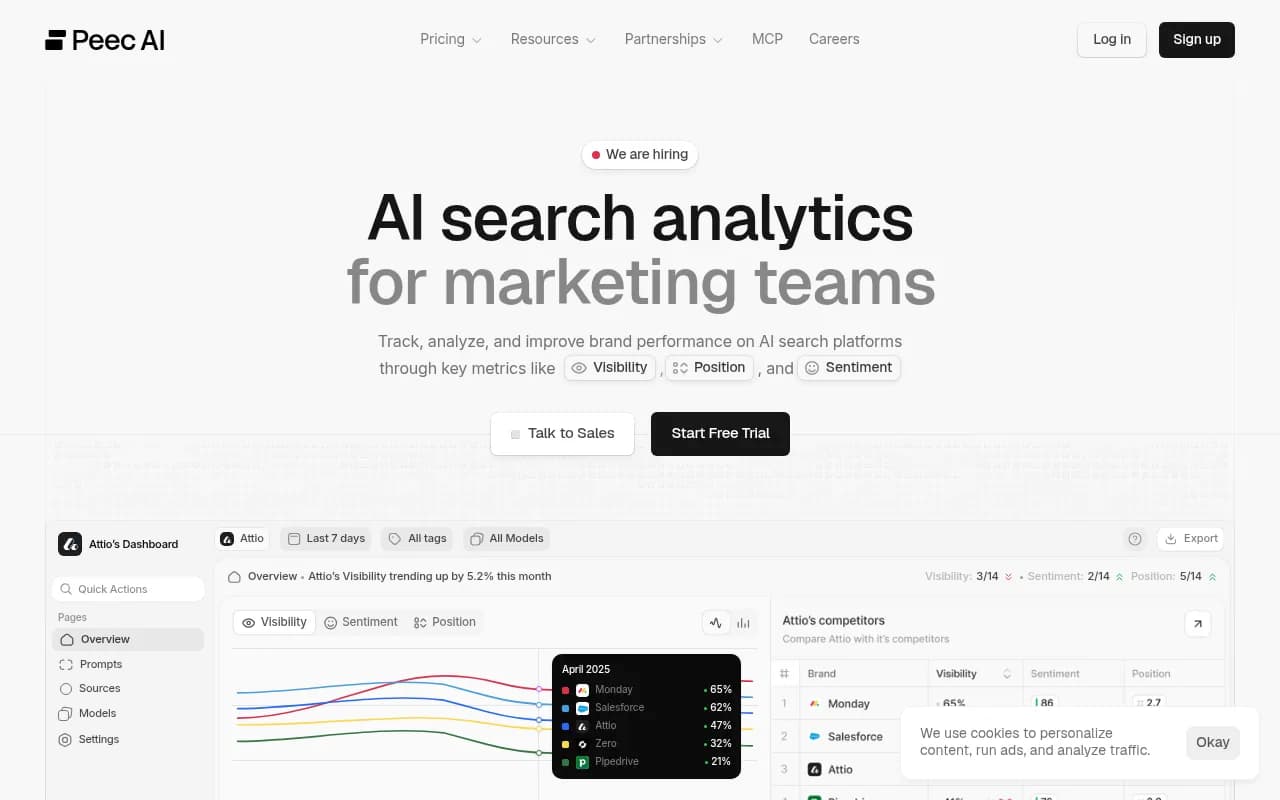
| Peec AI | Visibility tracking with suggestions |
| Otterly.AI | Lower-cost brand visibility monitoring |
| Profound | Enterprise analytics |


My view: dashboards that stop at the score leave the hard part to you. The metric is only a pointer. What matters is whether you can trace it to a cause and test a fix. Promptwatch's comparison of GEO platforms goes through that difference in more detail, and the GEO software directory at bestgeosoftware.com lists more options if you want to browse beyond these.
If you want a quick baseline before committing to anything, Promptwatch's free AI visibility report runs a no-login scan of how ChatGPT, Gemini and Perplexity talk about your brand. Pricing and the 7-day free trial are at promptwatch.com/pricing.
FAQ
Is Visibility Score the same as Share of Voice?
No. Visibility Score is about your own presence. Share of Voice is your share relative to competitors. The first says how often AI names you. The second says how often it names you instead of them.
Is Share of Voice the same as Share of Answer?
Not exactly. Share of Answer is usually the percentage of tracked prompts where you are mentioned or recommended, which is closer to a presence rate. Share of Voice compares mentions to a competitor set.
Which metric should I report to leadership?
Lead with Visibility Score as the headline, then show Share of Voice against two or three named competitors so the number has context. Add Sentiment so nobody reads a high score as a good one by default.
My Share of Voice is high but traffic is flat. Why?
Common reasons: you appear on irrelevant or branded prompts, models name you without citing your pages, or AI crawlers cannot reach your content. Check self-citation rate and crawler access first, then topic-level breakdowns. To tie it to revenue, use visitor analytics that identify AI-referred sessions. Promptwatch's guide to attributing AI traffic covers this.
How many prompts do I need?
Enough that one odd response cannot move the number. Start with a set tagged by topic, persona and funnel stage, and keep it stable so trends mean something. For deeper background, the Promptwatch Data hub has the underlying research on how AI answers are built.
The short version
Use Visibility Score to see whether things are moving. Use Share of Voice to see whether you are winning against specific rivals. Use Position to see whether you are leading or trailing within the answer. Then pick the weakest one, trace it to its cause with citations and crawler data, fix one thing, and measure again.