Key takeaways
- AI answers change between runs, so AI visibility is a percentage across many runs, not a fixed rank. Frequency matters more than it does for keyword tracking.
- Daily tracking is the sensible default. The big platform shifts in 2026 were overnight step changes that stayed in place, and a daily cadence catches them.
- Hourly tracking is for launches, campaigns and crisis monitoring. It will not help you much with steady-state reporting.
- Weekly tracking works only if each weekly number is built from several runs per prompt. A single weekly check is a coin flip.
- A rule that holds up: track daily, judge weekly, report monthly. Annotate model release dates so you can tell platform changes from real changes in your visibility.
Why AI rankings are not like keyword rankings
In classic rank tracking, position 5 is position 5. Google returns roughly the same result when you check twice, so a weekly check gives you a fair picture.
LLMs are probabilistic by design. Run the same prompt five times and you get five answers. The brands named, their order and the sources cited can all shift. One tracker vendor, Searchable, studied nearly 3,000 runs and found the chance of two runs returning the same brands in the same order was about 1 in 1,000. That is vendor data, but it matches what anyone sees who has pasted the same question into ChatGPT twice.
The same vendor reports, from 3,627 brands tracked in the 30 days to September 18, 2026, that a brand which appears on an unbranded prompt at all shows up in only about 40% of that prompt's runs. So one check has worse odds than a coin flip of telling you the truth.
That changes the question. You are not asking "where do I rank?" You are asking "how often do I appear, across enough runs to trust the number?" Check frequency is really a sample-size decision.
What the data says about how fast AI answers change
Two of the largest changes in 2026 tell you most of what you need to know about cadence. Both come from Promptwatch Data, which collects answers from the real interfaces of ChatGPT, Gemini, Perplexity, Claude and Google AI Overviews.
The GPT-5.3 citation drop
The GPT-5.3 rollout landed on March 4, 2026. In the week before, ChatGPT cited about 6.4 sources per search-enabled response. By late March it was about 4.7 to 4.9, roughly 27% fewer, with no recovery a month later. The change happened within a day and hit every ChatGPT model. The full numbers are in Promptwatch's ChatGPT citation drop report.
The site: operator switch
On August 8, 2026, ChatGPT Search started using the site: operator at scale. The share of fanout queries using it jumped from about 0.37% to 16.8% in one day, and average fanout queries per response rose from about 1.08 to 1.83 and stayed there. See ChatGPT Search now uses the site: operator at scale for the daily chart.
What this means for frequency
Both events were step changes, not hourly wobble. They happened inside a single day and persisted for weeks or months. Daily tracking catches them the morning after. Weekly tracking would show you a drop at some point in the following seven days and leave you guessing about the cause. Hourly tracking would not have told you anything extra.
The lesson is also about interpretation. Before you blame your content for a dip, check the date against model releases. If citations per response fell everywhere, the problem is not you.
Slow-moving content does not need fast checks
Promptwatch's content half-life study followed every page ChatGPT cited on July 6, 2026 for 90 days. After 30 days ChatGPT still cited 78% of landing pages and 76% of docs. Product pages, reviews and how-tos have half-lives of 74 to 77 days. News is the exception: half of news pages were gone after 36 days.
If your visibility depends on evergreen pages, nothing moves hour to hour. If it depends on press coverage, expect short bursts, and tighter monitoring makes sense around them.
Hourly, daily, weekly and monthly compared
| Cadence | What it catches | What it misses | Best for |
|---|---|---|---|
| Hourly | Launch-day swings, campaign effects, PR crises | Nothing, but most of it is noise outside special events | Product launches, active campaigns, high-stakes brand queries |
| Daily | Platform-wide step changes within 24 hours, early movement after content updates | Intra-day variance | Default for most brands and agencies |
| Twice or three times a week | Trends once a baseline exists | Single-day events, so causes are harder to pin down | Mature programs with stable numbers |
| Weekly | Slow trends | Sudden shifts, plus high variance if each point is one run | Small budgets, long-tail prompts |
| Monthly | Big-picture direction | Almost everything | Executive reporting, quarterly baselines |
Not everyone agrees on the answer. A LinkedIn post making the rounds says check once a month with a fuller baseline each quarter. A Reddit thread on r/aeo questions whether daily is needed at all, since nearly every tool runs daily by default. Both have a point for reporting. Neither works for diagnosing, because you cannot go back and collect yesterday's answers.
A cadence that works: track daily, judge weekly, report monthly
This rule comes from classic rank tracking and fits AI visibility even better, because each job needs a different time frame.
Track daily so the data exists
Daily tracking gives you about 30 answers per prompt a month, against about 4 for weekly. More runs mean the average is less shaky. And when something changes on the 14th, you have the 14th.
One vendor, ScaleTheory, suggests a staged approach: daily for weeks 1 and 2 to build a baseline (14 citation sets per prompt instead of 2), three times a week for weeks 3 to 6 to check the numbers hold, then twice a week from week 7. I like the calibration idea. If a prompt shows 65% presence at daily frequency and about 65% at three times a week, your steady-state cadence is trustworthy. If it swings, keep the higher frequency. Treat the exact schedule as one team's opinion rather than a standard. I did not find any expert guidance on an exact run count per prompt.
Judge weekly so noise cancels out
Read 7-day averages, not single days. A brand at 70% one week and 20% the next, then back again, is usually a sampling problem, not a real story. Compare this week's average with last week's, and only act when the move is larger than the usual week-to-week wobble.
Report monthly so changes have time to show
Content changes take time to be recrawled and picked up as citations. Monthly reports give real movement room to appear and keep stakeholders from reacting to noise.
When hourly tracking is worth it
Hourly is rarely needed, but there are three honest cases:
- A launch, rebrand or major PR moment, where you want to watch how answers shift as coverage spreads.
- A live campaign where you are testing whether new content or outreach changes mentions within hours.
- Crisis or reputation monitoring, where a wrong claim about your brand needs a fast response.
Outside those, hourly data mostly gives you more noise to average away. Plans that offer it, such as Promptwatch's Business and Agency Scale tiers (every 12, 6 or 1 hours), are best used for a defined window, then dialed back to daily.
When weekly is enough
Weekly can be fine for small sites, slow niches and tight budgets, with one condition: each weekly figure must come from several runs of each prompt, not one. Some tools report "weekly" meaning a single sample per prompt per week. That is a trend line made of coin flips.
A middle path works well. Track your 20 to 50 money prompts daily, the long tail weekly. Prompts tied to revenue or pipeline deserve the denser sampling.
How tools differ on cadence and cost
Cadence is a pricing lever, so compare plans by checks per day, not by prompt count. Multiply prompts by engines tracked to get checks a day, then look at the cost per check. Missing context there is where cheap plans get expensive. Mission Growth's 2026 pricing comparison makes the same point: daily is 30 answers per prompt a month, weekly about 4, and some plans spread a monthly total across several platforms, so a bigger number does not always mean denser sampling.

Promptwatch runs prompts daily on every plan and offers 12, 6 or 1-hour monitors on Business and Agency Scale. It collects answers from the real interfaces of the AI engines instead of only APIs, which matters because user-facing answers can differ from API outputs. Pricing starts at $95 a month for Essential, so confirm current plans at promptwatch.com/pricing.
| Tool | Cadence notes | Good fit |
|---|---|---|
| Promptwatch | Daily on all plans, up to hourly on higher tiers | Teams that want tracking plus crawler logs and content fixes |
| Peec AI | Daily-style monitoring of prompt sets | Teams wanting straightforward prompt tracking |
| Otterly.AI | Budget monitoring, engines vary by plan | Small teams on tight budgets |
| Rankscale | Scheduling from hourly to monthly | Teams that want flexible scheduling |
| Nightwatch | Rank tracking extended into AI, includes AI Mode on plans | Teams already tracking classic rankings |
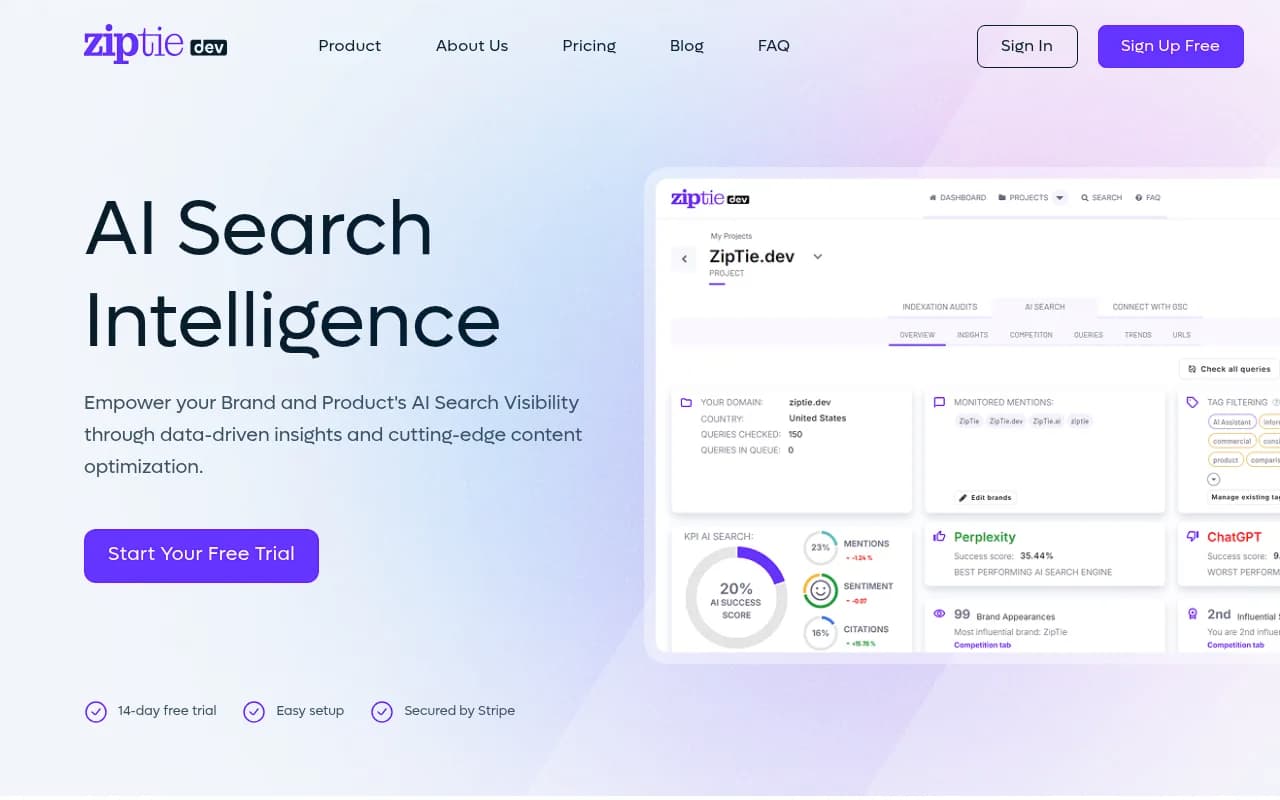
| ZipTie | Priced per check across engines including AI Overviews | Cost-per-check comparison |
I did not verify current refresh cadence or pricing for every tool above, so check each vendor's page before you buy. If you want to browse more options, the AI rank tracker directory lists many of them.
Questions to ask any vendor about cadence
- How many times is each prompt run, per engine, per week?
- Are results from the real interface or an API?
- Can I see the raw answers behind a score?
- Can I change frequency per monitor, or only per account?
- Does the report show variance, or only an average?
A weak answer avoids the run-count question. No one can hand you a universal minimum, but a good vendor can tell you their own and show the variance they see.
Setting up your cadence this week
- Pick 20 to 50 prompts that map to revenue, plus a longer tail of informational ones.
- Track the money prompts daily across the engines your buyers use, and the long tail weekly or a few times a week.
- Run daily for the first two weeks to build a baseline.
- Compare presence percentages at lower frequency before you commit to it.
- Keep a log of model releases and platform changes, like March 4 and August 8, so you can annotate charts.
- Review a 7-day average once a week, and report monthly.
- Switch a monitor to hourly only for a launch or campaign window.
The exact number is less important than being consistent about it. Change your cadence mid-program and you cannot compare before and after.
FAQ
Is daily AI rank tracking worth it?
For brands where AI answers influence revenue, yes. Daily tracking catches platform-wide shifts within a day and gives you enough runs per prompt to average. For a small brochure site, a few runs a week can be enough.
Do I need hourly tracking?
Not usually. The big 2026 changes in ChatGPT behavior were step changes that persisted, so hourly adds little. Use it for launches, campaigns and crisis monitoring.
Why does my visibility jump around week to week?
Because each answer is a sample. If a weekly figure rests on one run per prompt, swings from 70% to 20% are normal sampling noise. Add runs, average over seven days, and check whether the platform changed.
How do I know if a drop is my fault or the platform's?
Check whether competitors and citations per response dropped on the same date. If so, it is likely a model or search-behavior change. If only you dropped, look at your own pages, crawlability and content gaps.
Does the same cadence apply to every AI engine?
Start with the same one, then adjust. Engines differ. In one brand's data from Searchable, ChatGPT named it in 27.7% of unbranded answers while Google AI Overviews named it in 17.9%, so compare each engine against its own history rather than against each other.
The short version
Track daily, judge weekly, report monthly. Go hourly only when something specific is happening, and treat weekly as acceptable only when each point averages several runs. For more on how AI engines build answers, browse Promptwatch Data.