Key takeaways
- A GEO dashboard your CMO will trust must connect AI visibility metrics to revenue outcomes -- citation counts alone won't survive a board review.
- The metrics that matter: AI share of voice, answer gap coverage, citation-to-traffic conversion, and AI-influenced pipeline -- not raw mention volume.
- Most GEO tools are monitoring dashboards. The ones worth reporting on are the ones that help you act on what you find.
- Treat GEO reporting like any other channel: it needs attribution, trend lines, and a clear story about what changed and why.
- Build the dashboard in layers -- executive summary first, drill-downs second -- so your CMO gets answers in 30 seconds, not 30 minutes.
Marketing budgets dropped to 7.7% of company revenue in 2024, according to Gartner's CMO Spend Survey. That number has been falling for two years. Every channel you run now has to justify itself in revenue terms, not activity terms. GEO -- Generative Engine Optimization, the practice of making your brand visible in AI search answers -- is no exception.
The problem is that most GEO reporting is still stuck in the activity layer. You get a chart showing how many times ChatGPT mentioned your brand this week. Maybe a breakdown by model. Maybe a list of prompts where you appeared. That's useful for the team running the program. It's not useful for a CMO who needs to answer "is this working?" in a board meeting.
This guide is about building the bridge between those two things: the raw AI visibility data your team tracks and the revenue-oriented story your CMO needs to tell.
Why most GEO dashboards fail at the executive level
The gap is the same one that's always existed between marketing operations and executive reporting. Marketers optimize for the metrics they can control. Executives need to see the metrics that predict business outcomes.
In traditional SEO, this played out as: "We grew organic traffic 40%" vs. "We grew organic-influenced pipeline by $2.1M." The first number is interesting. The second one gets budget approved.
GEO is at exactly the same inflection point right now. Most teams are reporting on:
- Brand mention counts across AI models
- Share of voice percentages
- Which prompts they appear in
- Citation source breakdowns
These are the equivalent of impressions and click-through rates. They're not wrong to track -- they're just not what a CMO cares about in isolation. The question a CMO will ask is: "If we improve our AI visibility score by 20 points, what happens to revenue?" If your dashboard can't answer that, it won't survive contact with the C-suite.
The three questions your GEO dashboard must answer in 30 seconds
Borrow the framework from how the best CMO dashboards are built. According to Improvado's 2026 CMO dashboard guide, a board-ready executive dashboard answers exactly three questions before anything else:
- Are we hitting our targets?
- Where is there a problem?
- What changed since last week?
Apply that to GEO specifically:
- Is our AI visibility growing, and are we on track against our share-of-voice goal?
- Which prompts or topics are competitors winning that we're not?
- What shifted in AI model behavior or citation patterns this week?
If your dashboard leads with those three answers -- clearly, visually, without requiring the reader to dig -- you've already done more than 90% of GEO dashboards out there.
The metrics that actually belong in a CMO-level GEO report
Not every metric your GEO tool surfaces belongs in the executive view. Here's how to sort them.
Tier 1: Revenue-connected metrics (always in the exec view)
These are the metrics that connect AI visibility to business outcomes. They're harder to measure but they're the ones that justify the program.
AI-influenced pipeline. Track leads and opportunities where the contact touched an AI-generated answer before converting. This requires some attribution work -- either through UTM parameters on AI-referred traffic, or through CRM tagging -- but it's the single most compelling number you can put in front of a CMO. "AI search drove $X in influenced pipeline this quarter" is a sentence that gets budget renewed.
Citation-to-traffic conversion rate. When AI models cite your content, some percentage of users click through. That's measurable. Track it by model (ChatGPT vs. Perplexity vs. Google AI Overviews behave differently), by topic cluster, and over time. A rising citation rate with a flat or falling click-through rate tells a different story than both rising together.
AI share of voice vs. competitors. This is your headline visibility metric. For a defined set of prompts relevant to your category, what percentage of AI answers include your brand vs. competitors? This is the GEO equivalent of organic search market share, and CMOs understand market share intuitively.
Tier 2: Leading indicators (in the exec view as trend lines, not headlines)
Answer gap coverage. Of the prompts your target customers are asking AI models, what percentage does your content currently answer? This is a leading indicator of future visibility -- gaps today become citation losses tomorrow. It also directly drives content investment decisions.
Prompt volume and difficulty. Not all prompts are equal. A prompt asked 50,000 times a month where you're invisible is a bigger problem than a niche query where you rank first. Show your CMO the high-volume, high-value gaps, not just the total gap count.
AI crawler activity. Are AI models actively crawling your site? How often? Which pages? If Perplexity crawled your pricing page 400 times last month and never cited it, that's a signal worth surfacing. This kind of data -- when you can get it -- tells you whether your content is being considered but not selected, which is a very different problem than not being crawled at all.
Tier 3: Operational metrics (team dashboards only, not exec view)
- Individual prompt rankings by model
- Citation source breakdowns (Reddit, YouTube, third-party sites)
- Specific page-level citation counts
- Model-by-model response text analysis
These matter for the team doing the optimization work. They don't belong in the CMO view unless there's a specific anomaly worth escalating.
How to structure the dashboard itself
Layer 1: The executive summary (one screen, no scrolling)
This is the only layer your CMO will look at most weeks. It should have:
- AI share of voice: current vs. last period vs. target
- AI-influenced pipeline: current quarter, trending
- Top 3 answer gaps by prompt volume (with a "fix" status indicator)
- One variance callout: what changed most since last week and why
Keep it to four panels. The instinct is always to add more. Resist it. Every metric you add dilutes the signal.
Layer 2: Channel and model breakdown (one click down)
When your CMO wants to understand where the share of voice is coming from or where it's leaking:
- Visibility by AI model (ChatGPT, Perplexity, Google AI Overviews, Gemini, etc.)
- Visibility by topic cluster or product line
- Competitor heatmap: who's winning which prompts
This layer is for the weekly exec team review, not the board.
Layer 3: Content and action view (team use)
- Specific prompts and gap analysis
- Content performance: which pages are being cited, which aren't
- AI crawler logs and crawl frequency
- Content briefs and optimization queue
Connecting GEO data to your existing CMO dashboard
The worst outcome is building a separate GEO dashboard that lives in isolation. Your CMO already has a dashboard for pipeline, CAC, and channel mix. GEO metrics should feed into that existing view as a channel -- not exist as a separate artifact that requires a separate conversation.
Practically, this means:
- Adding AI-influenced pipeline as a row in your channel attribution breakdown alongside paid search, organic, email, and events
- Including AI share of voice as a brand health metric alongside traditional brand search volume and NPS
- Reporting answer gap coverage as a content investment metric alongside content production volume and organic traffic
When GEO sits inside the existing reporting structure, it gets evaluated on the same terms as every other channel. That's actually what you want -- it forces the program to prove its value in revenue terms, which is the only way it survives budget cycles.
Choosing the right tools for CMO-level GEO reporting
The tool you use to track GEO matters a lot here, because most tools make the CMO reporting layer harder, not easier. A tool that gives you a raw data dump of citation counts is not the same as a tool that helps you build the revenue story.
The distinction worth making: monitoring tools vs. optimization platforms. Monitoring tools show you what's happening. Optimization platforms show you what's happening, tell you what to do about it, and let you track whether it worked. For CMO reporting, you need the latter -- because the CMO question is never just "where are we?" It's "what are we doing about it and is it working?"
Promptwatch is built around exactly this loop. It tracks AI visibility across 10 models (ChatGPT, Perplexity, Google AI Overviews, Claude, Gemini, Grok, DeepSeek, and others), surfaces the specific answer gaps where competitors are visible and you're not, generates content to close those gaps, and then tracks whether the new content gets crawled and cited. The page-level tracking and AI crawler logs are particularly useful for CMO reporting -- they let you show not just that visibility improved, but which specific content investments drove the improvement.
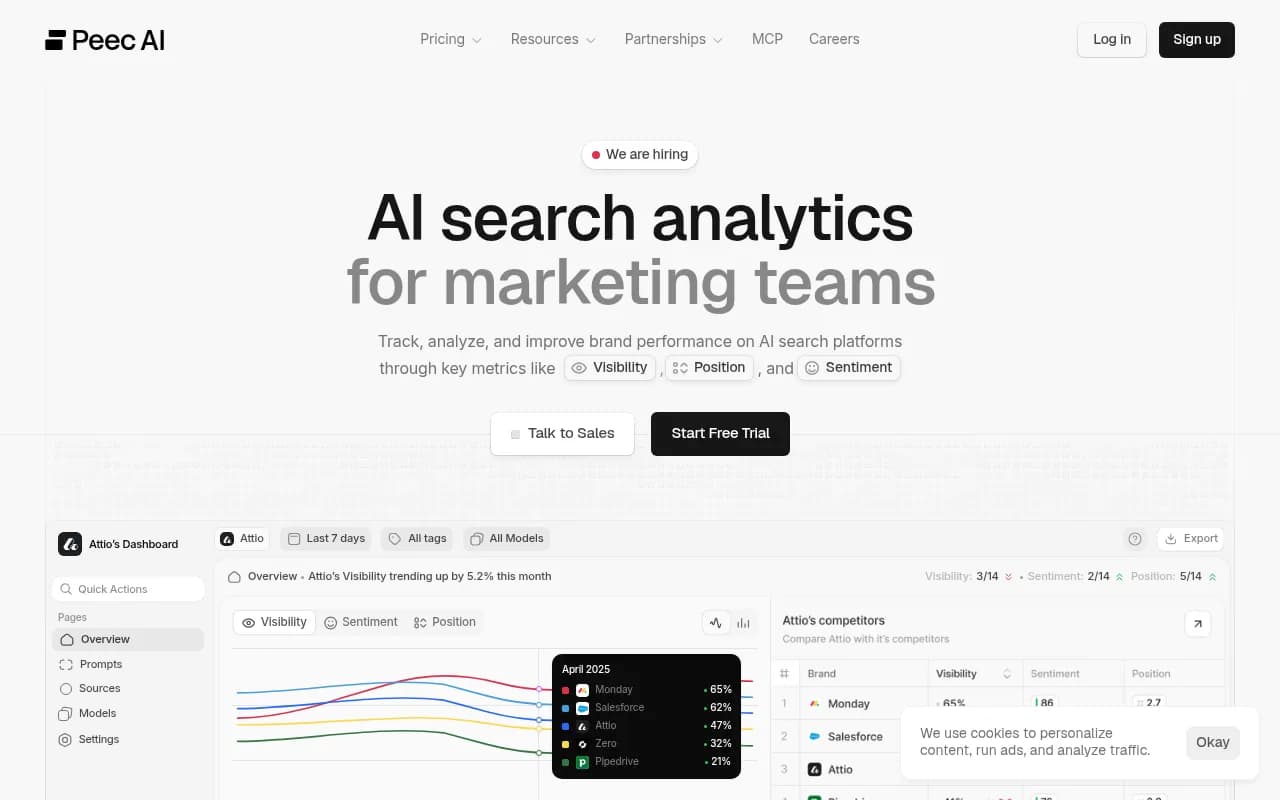
For teams that want to track AI visibility at a more basic level before committing to a full platform, tools like Otterly.AI and Peec AI offer lighter-weight monitoring. The tradeoff is that they stop at the data layer -- you get the numbers but not the "so what."
If your CMO dashboard already lives in Looker Studio or a similar BI tool, look for GEO platforms that offer API access or native integrations so you can pull AI visibility data into your existing reporting infrastructure rather than maintaining a separate tool.
A comparison of GEO tools for executive reporting
| Tool | AI models tracked | Answer gap analysis | Content generation | Crawler logs | API/export | Best for |
|---|---|---|---|---|---|---|
| Promptwatch | 10 | Yes | Yes (Content Agents) | Yes | Yes | Full GEO optimization + CMO reporting |
| Profound | 6+ | Partial | No | No | Yes | Enterprise monitoring |
| AthenaHQ | 5+ | Partial | No | No | Limited | Monitoring-focused teams |
| Otterly.AI | 5 | No | No | No | No | Basic brand monitoring |
| Peec AI | 4 | Limited | No | No | No | Lightweight tracking |
| Semrush AI Visibility | 3 | No | No | No | Yes | Teams already in Semrush |

The pattern is clear: most tools give you data. Promptwatch gives you data plus a path to act on it, which is what makes the CMO story coherent. "We found 47 high-volume gaps, created content to address 23 of them, and 18 are now being cited" is a much better board slide than "our AI visibility score is 62."
The readiness diagnostic: is your GEO program ready for CMO reporting?
Before you build the dashboard, check whether the underlying program can support it. A dashboard built on shaky data will undermine trust faster than no dashboard at all.
Ask yourself these questions:
- Do you have a defined set of prompts you're tracking consistently? (If the prompt set changes every month, trend lines are meaningless.)
- Can you connect AI-referred traffic to CRM records? (Without this, the pipeline attribution story falls apart.)
- Do you have baseline data from at least 60 days ago? (CMOs want to see trends, not snapshots.)
- Are your metric definitions documented and agreed on? (Finance will question any number that isn't defined in writing.)
- Can you explain a variance -- if AI share of voice dropped 8 points last week, do you know why?
If you answered no to three or more of these, build the foundation before you build the dashboard. A CMO who asks "why did this drop?" and gets "we're not sure" will trust the program less than if you'd never shown them the metric at all.
Common mistakes that kill GEO dashboard credibility
Leading with model-level data. "We appeared in 73% of ChatGPT responses" sounds impressive until someone asks "for which prompts?" and you can't answer. Always lead with business outcomes, use model-level data as supporting detail.
Reporting citation counts without context. 1,200 citations this month vs. 900 last month -- is that good? Compared to what? Always show citations relative to competitors and relative to prompt volume. Raw numbers without benchmarks are noise.
Mixing monitoring metrics with optimization metrics. If your dashboard shows both "AI mentions this week" and "content pieces published this week" without connecting them, you're reporting activity, not outcomes. The connection -- "we published X pieces targeting Y gaps, and Z of them are now being cited" -- is the story.
Updating too infrequently. If your CMO checks Salesforce daily and your GEO dashboard updates weekly, you'll always be behind the conversation. Aim for daily refresh on the headline metrics at minimum.
Building the dashboard for yourself. The team that runs the GEO program wants to see granular data. The CMO wants to see three numbers and a trend line. Build two views, not one.
What a good GEO dashboard slide looks like in a board deck
When your CMO takes GEO to the board, they need one slide that tells the whole story. Here's the structure that works:
- Headline metric: AI share of voice, current vs. 90 days ago vs. target
- Business impact: AI-influenced pipeline this quarter (dollar figure)
- Investment efficiency: cost per AI-influenced opportunity vs. other channels
- Forward-looking: top 3 gaps being addressed and expected timeline to citation
Four data points. One slide. The board doesn't need more than that -- and if they do, your CMO can pull up the drill-down view.
The bottom line
GEO reporting for CMOs is not a technical problem. It's a translation problem. You have data about AI visibility. Your CMO needs a story about revenue impact and competitive position. The dashboard is the translation layer between those two things.
Get the metrics right (share of voice, answer gap coverage, AI-influenced pipeline). Get the structure right (executive summary first, drill-downs on demand). Get the tooling right (a platform that helps you act on the data, not just collect it). And make sure the underlying program is solid enough that you can explain any variance without flinching.
Do those four things and you'll have a GEO dashboard that doesn't just survive a CMO review -- it becomes the artifact your CMO uses to defend the marketing budget.