Key takeaways
- Build a fixed prompt panel and baseline it for two to four weeks before the campaign starts. A single snapshot proves nothing.
- Use a control group (competitors, untouched topics) so platform-wide shifts do not get credited to PR or blamed on it.
- Report per engine. ChatGPT, AI Overviews, and AI Mode move independently, and sometimes in opposite directions.
- Choose your post-campaign window with content decay in mind. News coverage fades fast, so a fade is not a failed campaign.
- Track four things together: citations, mentions, share of voice, and AI-referred traffic.
PR teams have a new problem. The coverage lands, the clip report looks good, and then someone asks whether ChatGPT now recommends the brand. Reach and clicks cannot answer that. Pew Research found in June 2026 that 60% of Americans now read AI-generated summaries at the top of search results, so the answer matters.
The good news is that a before-and-after comparison works fine here, if you design it properly. Most attempts fail on design, not on tooling. This guide walks through the method I would use for a campaign report.
Why before-and-after is the right frame (and where it breaks)
PR is hard to attribute at the best of times. AI search adds two complications.
First, AI answers are probabilistic. Ask the same prompt ten times and you get a spread of answers, not one. So you need many prompts, repeated runs, and averages.
Second, the platforms change under you. Promptwatch Data shows how sharp these shifts can be. When GPT-5.3 rolled out on March 4, 2026, average citations per search-enabled ChatGPT response fell from about 6.4 to roughly 4.7-4.9, around 27% fewer citation slots, and there was no recovery a month later. If your campaign ran that week, a naive before-and-after would tell you PR hurt your visibility. It did not.
Reddit is another example. Reddit's share of ChatGPT citations averaged 3.83% from Jul 18 to Aug 7, 2026, then fell to about 0.52% from Aug 14 to 17. Promptwatch flags the size of that drop as provisional, but the lesson stands: in AI Overviews the same source eased only gradually, from about 2.5% to 2.1%. Each engine behaves differently.
So the method needs three guardrails: a baseline, a control group, and per-engine reporting.
Step 1: Define the campaign and the claim you want to prove
Write the hypothesis before you pull any data. Something like: "Our funding announcement and 12 earned placements will increase how often AI engines cite our brand and name us for category prompts."
Then list what the campaign actually produced:
- Press release URL and distribution date
- Earned media URLs and publication dates
- Owned pages updated or created to support the story
- Any third-party mentions (analyst notes, reviews, directories)
This URL list matters later, because you will check which of these pages AI engines cite.
Step 2: Build a fixed prompt panel
The prompt panel is your measuring instrument. Keep it fixed for the whole campaign. If you change prompts midway, you break the comparison.
A sensible panel for a mid-size brand has 30 to 100 prompts, grouped by type:
- Category prompts: "best [category] tools for [audience]"
- Comparison prompts: "[brand] vs [competitor]"
- Brand prompts: "what is [brand] known for", "is [brand] reliable"
- Problem prompts: the questions your buyers ask before they know your name
Business Wire's PR measurement guidance makes a similar point: build a standard set of prompts from the questions your audiences are asking. I would add that you should write them in your buyers' wording, not your own marketing language. Persona-based prompting helps here.
Tools that can run a panel on a schedule include Promptwatch, which tracks prompts from the real interfaces of ChatGPT, Gemini, Perplexity, Google AI Overviews, and others, with country and language settings.
Other options worth a look are Profound, Peec AI, Otterly.AI, and Scrunch. The AI rank tracking directory lists more.
Step 3: Capture a baseline (two to four weeks)
Run the panel daily, or at least several times a week, for two to four weeks before the campaign goes live. Why so long? To see your normal variance. If your visibility score bounces between 18 and 26 with no campaign at all, a post-campaign reading of 24 means nothing.
Record these baseline metrics per engine:
| Metric | What it tells you | Problem it locates |
|---|---|---|
| Citation frequency | How often your domain is cited as a source | Content or authority gap |
| Mention rate | Share of responses that name the brand | Coverage gap |
| Share of voice | Your slice of all brand mentions in the panel | Competitive position |
| Average position | Where you land in the list of brands | Prominence |
| Sentiment | Tone of what AI says | Reputation |
| Citations per response (platform-wide) | Whether engines cite fewer sources overall | Platform change, not you |
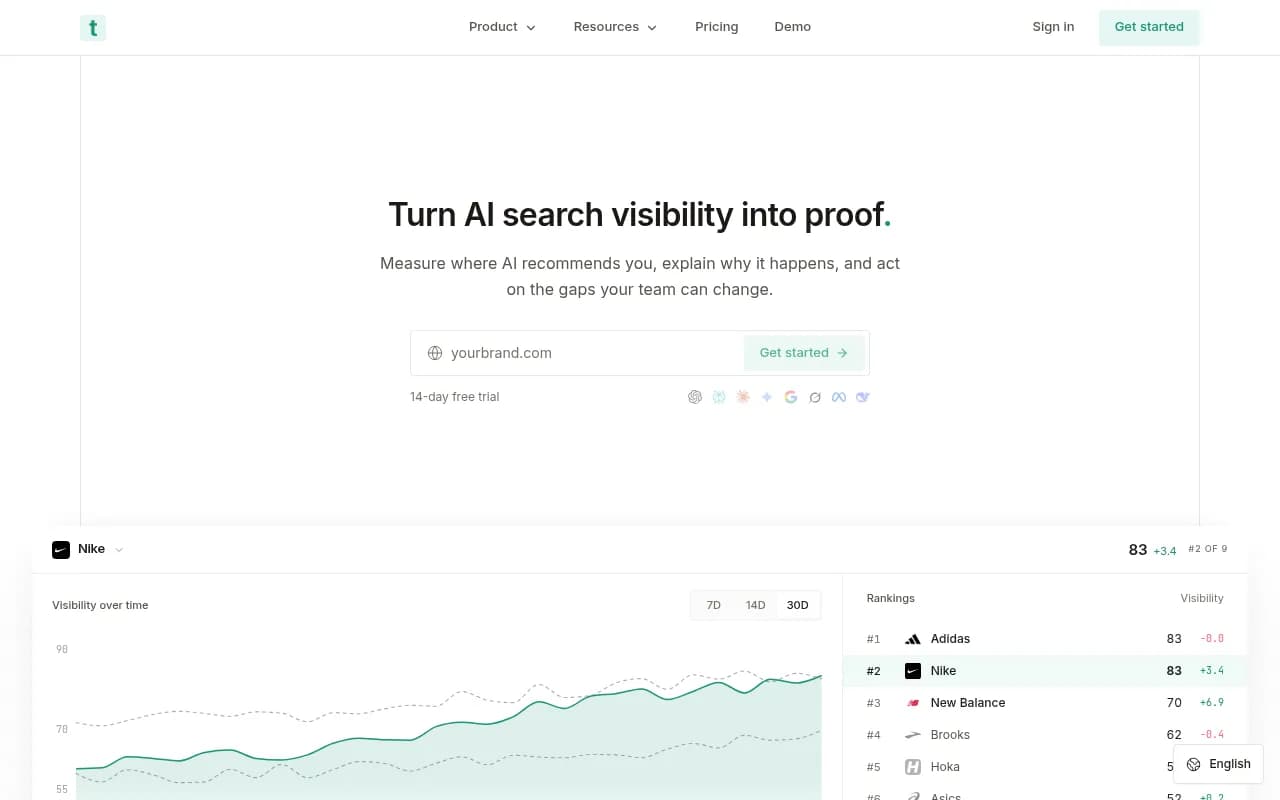
That last row is easy to skip and shouldn't be. Promptwatch's own advice from the citation-drop data is to track citations per response so you can separate "we lost visibility" from "ChatGPT cites fewer sources overall." For definitions of the core metrics, the Promptwatch Academy metrics overview and its pages on Visibility Score and Share of Voice are clear.
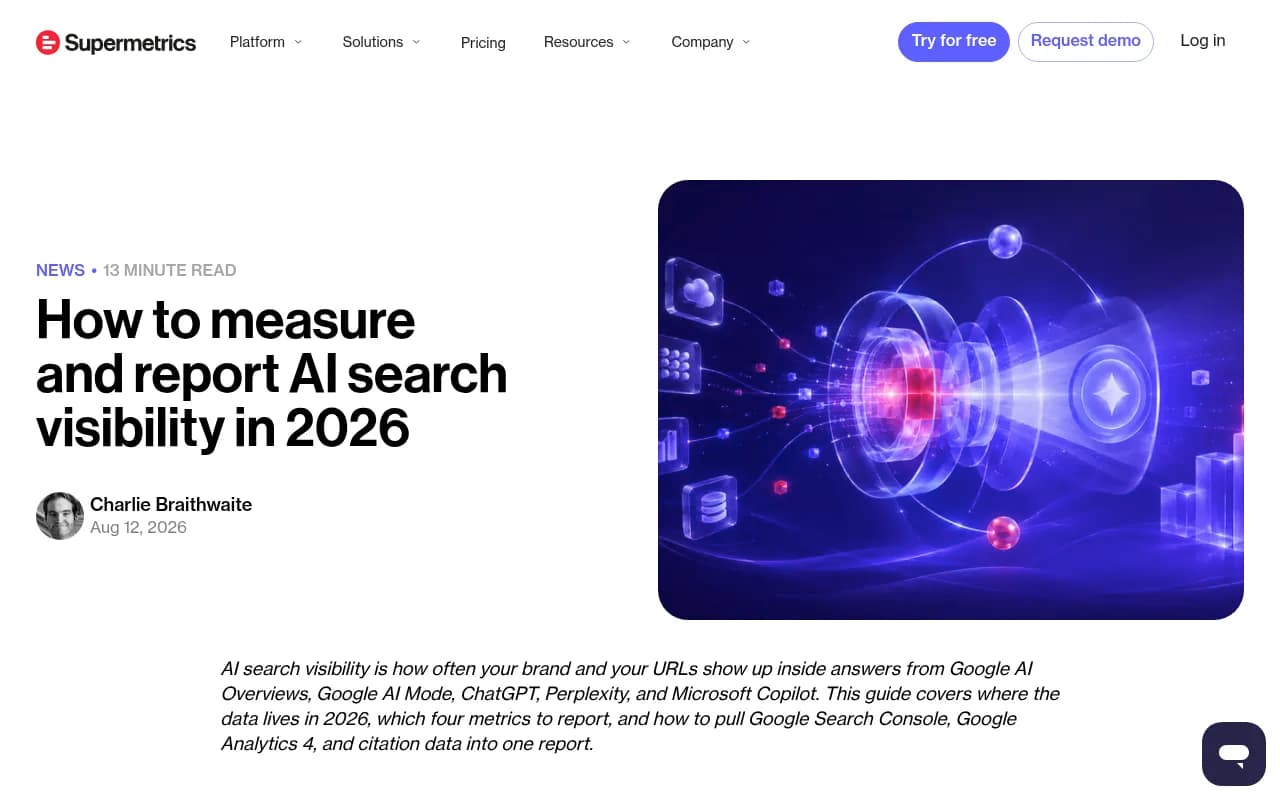
Also capture non-AI baselines: branded search impressions in Google Search Console, direct traffic, and AI-referred sessions in your analytics. Supermetrics suggests pulling Search Console and GA4 into one place and adding citation data on top, which is a sound way to build a single report. One caveat: Google's new generative AI reports in Search Console show impressions but no clicks or queries, so treat them as directional.
Step 4: Set up a control group
This is the step most teams skip, and it is the one that makes your report credible.
A control is anything the campaign should not have touched. Three options:
- Competitors: if every brand in your category drops 25% on one day, that is the engine, not you. Track your share of voice relative to them.
- Untouched topics: prompts about product lines or themes the campaign did not mention.
- Untouched engines or markets: if the campaign targeted US media, a UK monitor may serve as a rough control (imperfect, since news travels).
Then calculate lift as a difference of differences. If your citation rate rose 6 points and the control rose 2, the campaign-attributable lift is about 4 points. Not perfect science, but far more defensible than raw before-and-after numbers.
Check the date against known model releases before you interpret any dip. A quick glance at Promptwatch Data for platform changes around your campaign dates takes five minutes and can save an awkward meeting.
Step 5: Log the campaign timeline
Keep a simple dated log:
- Day 0: press release published
- Day 1-3: first earned placements
- Day 7: follow-up coverage
- Any owned-content updates
- Any known engine changes
Overlay it on your visibility charts. Notified's June 2026 study of more than 8,000 GlobeNewswire releases found that 99.3% were cited by ChatGPT or Claude, with an average time to first citation of eight hours, 25% of citations by day seven, and 50% by day 18. Releases cited on day one averaged 15 times more citations over the following 30 days. That is one vendor's dataset about its own distribution, so take the exact figures with some salt, but the timing pattern is useful: measure early, and keep measuring.
Step 6: Choose the post-campaign window with decay in mind
Here is where a lot of reports go wrong. Different content types stay cited for different lengths of time.
Promptwatch Data tracked every page ChatGPT cited on July 6, 2026 for 90 days. Landing pages and docs lasted longest: after 30 days ChatGPT still cited 78% of landing pages and 76% of docs. News decays fastest. Half of news pages were gone after 36 days, and almost a quarter were never cited again after day 0. Product pages, reviews, and how-tos reached their half-life at 74 to 77 days.
| Content type | Still cited after 30 days | Still cited after 60 days |
|---|---|---|
| Landing pages | 78% | 69% |
| Docs | 76% | 67% |
| Comparisons | 72% | 63% |
| Listicles | n/a | 60% |
| Product pages, reviews, how-tos | n/a | about 55% |
| News | about 50% gone by day 36 | 41% |
What does this mean for PR reporting? News-type coverage gives you a burst, not a plateau. Promptwatch's own takeaway is to use news and press coverage for short bursts of visibility. So:
- Report a short window (days 0-30) for news-driven lift, and expect it to fade.
- Report a longer window (days 30-90) for evergreen assets: landing pages, comparison content, docs, and the owned pages your PR story points to.
- Do not call a fade a failure. Say up front that news coverage is expected to decay and show the plateau you retained.
The practical trick: pair every news hit with an evergreen page that carries the same facts. Press creates the spike, the evergreen page holds the citation.
Step 7: Trace the lift to specific coverage
A visibility number that rose is a start. A stakeholder will ask which placement did it. Use citation data to answer.
For each response that cites you or names you, look at the sources behind it:
- Which of your campaign URLs were cited, and on which engines?
- Which third-party pages naming you (with or without a link) were cited?
- Which outlets show up most often across the panel?
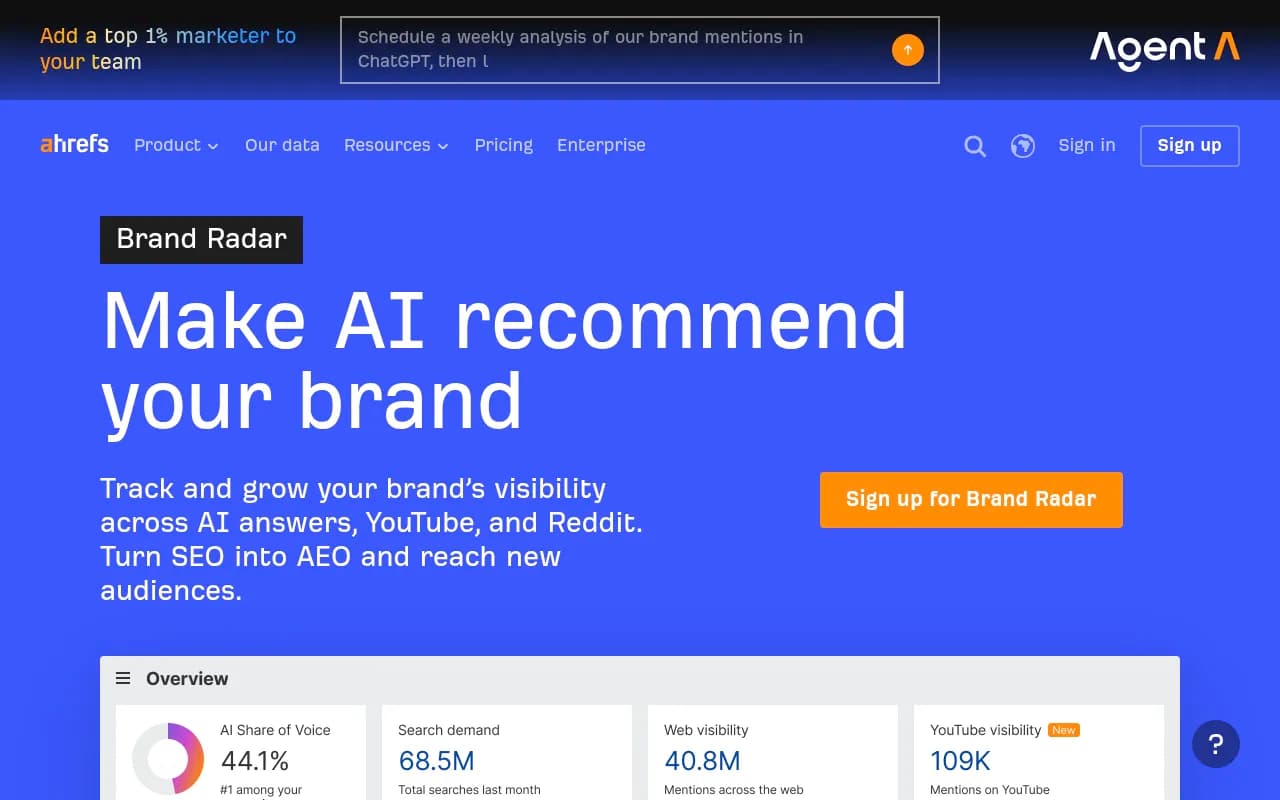
This is also where unlinked mentions earn their keep. A feature that names your brand but does not link to you can still be the page AI cites. Tools that surface offsite mentions and per-URL citation tracking help here. Promptwatch has a Page Tracker for watching specific URLs and Offsite Mentions for third-party pages that name the brand, and Ahrefs Brand Radar and Semrush offer related views if you already live in those suites.
Also check AI crawler activity on your owned pages. If a bot never fetched the page, a citation was never going to happen, and that is a technical fix, not a PR one. IP-verified crawler logs separate an access problem from a content problem.
Step 8: Add traffic and conversion impact
Citations are a leading indicator. Business wants revenue signals too.
- Compare AI-referred sessions before and after, by source (ChatGPT, Perplexity, Gemini, Copilot).
- Compare branded search impressions and clicks in Search Console.
- Compare conversion rate on AI-referred visits against other channels.
One warning: ChatGPT stopped sending a referrer on October 8, 2026, so referral-based counts undercount it. Tagging links with utm_source=chatgpt.com where you control them, and counting those visits, closes some of the gap. Promptwatch's guide on attributing AI traffic covers the setup. Trakkr and Passionfruit also pitch revenue attribution for AI visitors.

Expect small absolute numbers at first. Crisp reported 2x higher conversion rates from AI traffic than traditional channels, so volume may be modest while quality is high. See the Crisp case study.
Step 9: Build the report
Keep it to one page plus an appendix. CMOs read the first page.
Page one
- Campaign summary: dates, assets, goal.
- Headline result: change in citation frequency, mention rate, and share of voice, each with the control comparison.
- Per-engine table: ChatGPT, AI Overviews, AI Mode, Perplexity, Gemini.
- Top three coverage pieces that were actually cited.
- Traffic and conversion movement.
- Caveats: platform changes in the window, news decay, sample size.
Appendix
- Full prompt list and run counts
- Baseline variance
- Source and URL citation breakdown
- Timeline overlay
Cadence
Supermetrics recommends monthly reporting, weekly prompt sampling while a change is in flight, and a re-baseline after any major engine update. I agree. For a campaign, I would add a day-1 and day-7 check, since early citations seem to predict later ones.
Step 10: Interpret honestly
A few readings you will run into:
- Citations up, mentions flat: AI trusts your pages as sources but does not name you in answers. Look at content depth and brand clarity.
- Mentions up, citations flat: you are being talked about but not sourced. Check whether your owned pages are crawlable and answer the prompt.
- Everything up, control up equally: the market moved, not you.
- Everything down on one day across all brands: probably an engine change.
- Lift on ChatGPT only: could be how ChatGPT weights news. Test again before claiming a general effect.
Press releases, specifically: they may be cited quickly, but being cited is not the same as being recommended. Check sentiment and position, not just presence.
Tool options at a glance
| Need | Tools to consider |
|---|---|
| Fixed prompt panel across many engines, plus crawler logs and traffic attribution | Promptwatch |
| Enterprise monitoring | Profound, Brandlight, Scrunch |
| Lightweight, lower-cost tracking | Otterly.AI, Peec AI, Airefs |
| Inside an existing SEO suite | Semrush, Ahrefs Brand Radar, seoClarity |
| Press-release analytics plus AI visibility | GlobeNewswire by Notified (partnered with Profound) |
| Outreach and earned placements | Respona, Wellows, CrowdReply |
For wider browsing, the GEO software directory lists dozens of options.
One honest note on tool choice: monitoring-only dashboards will give you the before and after numbers, but they will not tell you why. If you want the same platform to show which pages were cited, whether bots could read your campaign pages, and what traffic came back, look at the end-to-end options. Promptwatch's free AI visibility report is a no-login way to get a rough baseline before you commit.
Common mistakes
- Changing the prompt list mid-campaign.
- Using a single snapshot as the baseline.
- Reporting one blended score across engines.
- Ignoring model releases and platform changes.
- Measuring news coverage at day 90 and calling it a miss.
- Counting only linked citations and missing named mentions.
- Reading tiny sample sizes as proof.
A simple worked example
Say you run a product launch. Baseline over three weeks: your brand is mentioned in 22% of 60 category prompts on ChatGPT, with competitors averaging 31%. Citation frequency of your domain is 4%.
Three weeks after launch, you are mentioned in 29%, and your domain is cited at 6%. Competitors moved from 31% to 33%.
Raw lift: 7 points of mentions. Control-adjusted: 7 minus 2 = 5 points. Citation lift: 2 points. Check the sources: two of your evergreen comparison pages and one trade-press feature account for most new citations. At day 60, the feature has faded but the comparison pages hold. That story is clear, defensible, and honest about what faded.
That is the whole method: a stable panel, a baseline, a control, a decay-aware window, and a source trace. None of it needs exotic tooling. It needs discipline about not changing the ruler mid-measurement.
If your team lacks the bandwidth to run this, 1001 SEO Media runs AI visibility reporting alongside digital PR for clients, using Promptwatch as its platform.