Key takeaways
- You don't have a fixed rank in AI Overviews. Position changes between runs, devices and locations, so measure how often you are cited across a fixed set of queries.
- Track four things: appearance rate of AI Overviews on your queries, your citation rate, competitor citation share, and AI-driven sessions and conversions.
- Sample repeatedly. A single check proves nothing, and AI Overview citations shift month to month in Promptwatch's data.
- Report AI Overviews separately from ChatGPT and other engines. They cite very different sources.
- Combine Google Search Console and GA4 (free) with a dedicated tracker for URL-level citation data. The template at the end gives you a monthly format.
Why "do I rank?" is the wrong question
In classic SEO you rank fourth for a keyword, and that is mostly true for everyone who searches it. AI Overviews don't work like that. The summary may not appear at all for a given query, the cited sources can differ between two users, and the order of those sources can change an hour later.
One of the tool vendors in the research put it plainly: AI presence isn't deterministic. A research piece from Bullzeye goes further and argues rank doesn't exist in AI search in any stable sense. Position within a generated answer changes between runs of the same prompt, so a position captured once is not a repeatable measurement.
I think that is right, with one caveat. Position still matters a little. Keyword.com notes that ranking position is still the strongest lever for source URL performance, which makes sense because AI Overviews draw on the same index as organic results. So keep your classic rank data. Just stop treating it as the answer.
The replacement question is: across a defined set of queries, how often does Google's AI Overview appear, and how often are we in it?
The metrics that are worth reporting
Different sources use different names. Boiled down, these are the ones that survive scrutiny.
1. AI Overview trigger rate
Of the queries you care about, what percentage show an AI Overview at all? Keyword.com calls the related idea a visibility score: a high, stable score means Google reliably generates an overview for that query, while a fluctuating one means Google is still testing. Otterly.AI suggests trending this weekly to catch Google expanding or contracting AI Overviews in your niche.
This metric is about the query set, not about you. But it tells you how much of your market is exposed to AI Overviews in the first place.
2. Citation rate
Of the queries that trigger an AI Overview, what share cite your domain? Otterly.AI calls this the core performance metric and suggests aiming for 30% or more in your primary topic cluster. That number is a vendor's rule of thumb, not an industry standard, so use it as a starting target and adjust to your category.
3. Run-level consistency
Track how often you appear across repeated runs of the same query, not whether you appeared once. Bullzeye's example is a good one: a brand that shows up in nine of twenty runs is in a materially different position than one that showed up in one of twenty, and a single-run report can't tell them apart. The Supermetrics guide suggests sampling each prompt three to five times per engine in a logged-out session and recording the rate.
4. Competitor citation share
For the same queries, how often do your top three competitors appear? This is your share of voice, and it is usually the number executives understand fastest. Semrush's reporting guide suggests a table of your citation share rank for your top 10 category prompts against your top two competitors.
5. Cited URL distribution
Which of your pages earn the citations? This shows what Google considers authoritative on your site and tells you where to put content effort. Otterly.AI lists it as a monthly metric.
6. AI-driven sessions and conversions
Impressions and citations are visibility. Sessions and conversions are business impact. Pull sessions from GA4 and tie them to sign-ups or demo requests where you can. Otterly.AI suggests a quarterly attempt at revenue attribution, even if rough, to justify the monitoring spend.
Where the data comes from
Google Search Console
The Supermetrics guide (August 12, 2026) says Google announced Search Console generative AI performance reports in June 2026, covering impressions for AI Overviews, AI Mode and Discover AI features, broken down by page, country, device and date. It also says the report carries no click, CTR or query data. Other vendor pieces say Search Console doesn't show which specific URLs are cited in AI answers. These claims differ in detail, so check Google's own Search Console documentation for what your account actually reports before you build a dashboard around it. Either way, Search Console is the free first-party baseline.
Google Analytics 4
GA4 shows the sessions that arrived. The catch is that AI Overview clicks are mixed into regular Google organic traffic, so GA4 alone can't isolate them. Semrush's advice for this is to use a dedicated tool for AI Overviews and AI Mode visibility, and use web analytics to spot other AI platforms that send traffic. If a platform is sending you visitors, it is citing you.
A dedicated tracker
For URL-level citations, competitor comparison and history, you need a tool that runs a fixed query panel on a schedule and stores the results. Omnia's evaluation criteria are a good checklist: timestamped SERP snapshots, URL-level citation extraction, presence by country, and share of voice against competitors. If a tool only gives you a "visibility score" with no evidence of what Google actually displayed, be skeptical.
Manual checks
For a small set of keywords, you can do this by hand. Run each query in a logged-out browser, record whether an AI Overview appears, who is cited, and in what order. Repeat it several times on different days. It is tedious, but it teaches you what the output looks like before you pay for automation.
Why you must report AI Overviews separately
Don't blend every engine into one "AI visibility" number. In Promptwatch Data's social media citations report for Sep 28 to Oct 4, 2026, social platforms made up 12.2% of AI Overview citations, about 26 times ChatGPT's 0.46% share. Perplexity sat at 2.7%.
The source mix also moves. In Promptwatch's Google AI Overview citation share data for June 2026, YouTube held 4.16% of citations, Reddit 2.72% and google.com 2.30%, all 2026 highs. google.com's share was 0.37% in January and doubled from May to June. That report also warns that month-to-date figures can overstate momentum for fast risers.
There are two practical lessons here. First, audit which of your target queries cite google.com surfaces such as Business Profile or Merchant Center, because being present there is a way to be present in the overview. Second, a snapshot misleads, so trend over time.
Format matters as well. Promptwatch's July 2026 AI Overviews citation types report shows listicles at 18.0%, product pages at 16.3%, how-tos at 15.1% and news articles at 13.5% of classified citations. From July 28, product pages were the most cited format every day, the first time listicles lost the top spot. When you review your cited URL distribution, compare your content types against this mix.
Tools for tracking AI Overviews
Pricing wasn't verified for this guide, so confirm current plans on each vendor's site. Here is how the options group.
| Tool | Type | What it gives you for AI Overviews | Best for |
|---|---|---|---|
| Google Search Console | Free, first-party | Impression data for AI features (check current report scope in Google's docs) | Baseline, every team |
| GA4 | Free, first-party | Sessions and conversions, though AI Overview clicks blend into organic | Business impact |
| Promptwatch | AI visibility platform | Real-UI tracking of Google AI Overviews and AI Mode, citation analytics, crawler logs, visitor analytics, and content actions | Teams that want to fix gaps, not just see them |
| Semrush AI Visibility Toolkit | SEO suite add-on | Mentions, citations, share of voice by platform, GA and GSC integration | Teams already on Semrush |
| SE Ranking | SEO and GEO platform | Daily AI Overview monitoring, source analysis | Mid-size SEO teams |
| Ahrefs Brand Radar | SEO suite add-on | AI citations module and SERP detection | Teams already on Ahrefs |
| Keyword.com | Rank tracker | Per-keyword AIO presence trends | Keyword-level monitoring |
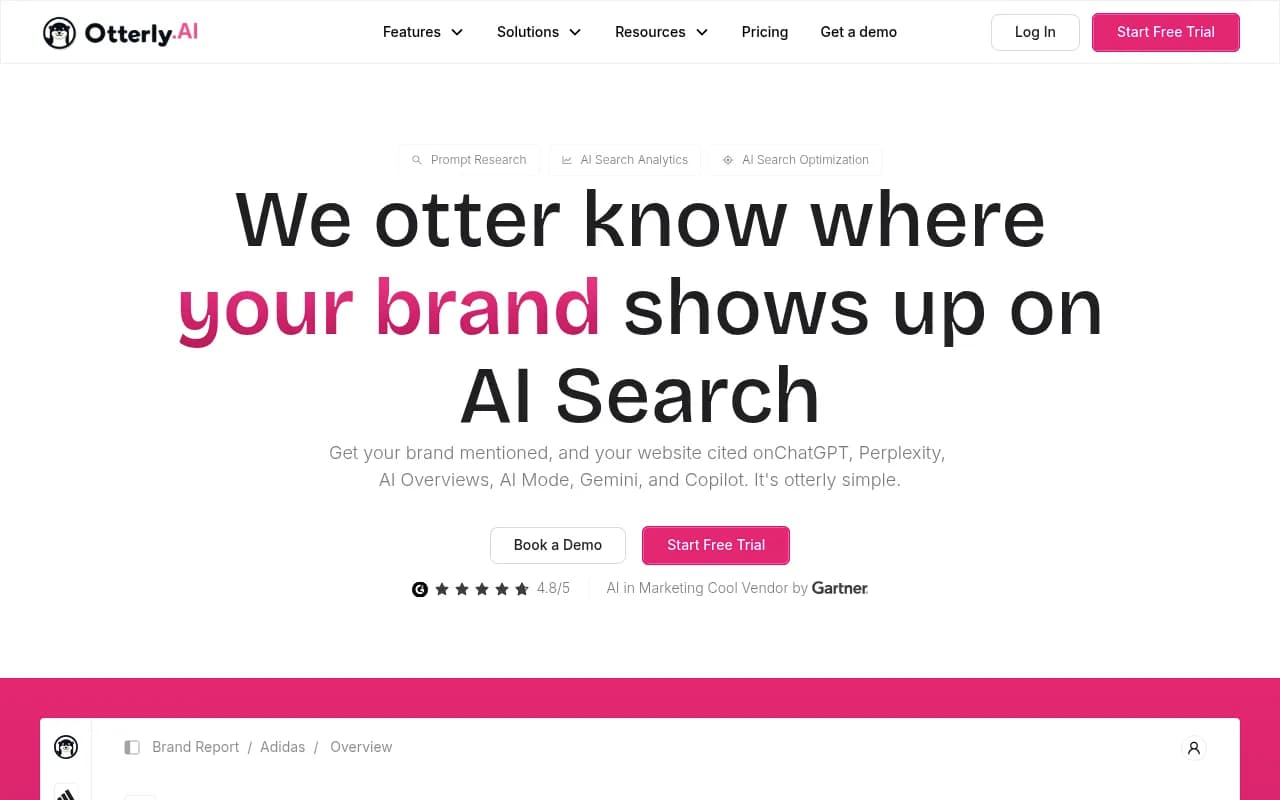
| Otterly.AI | Prompt tracker | Citation rate and competitor share | Lighter budgets |
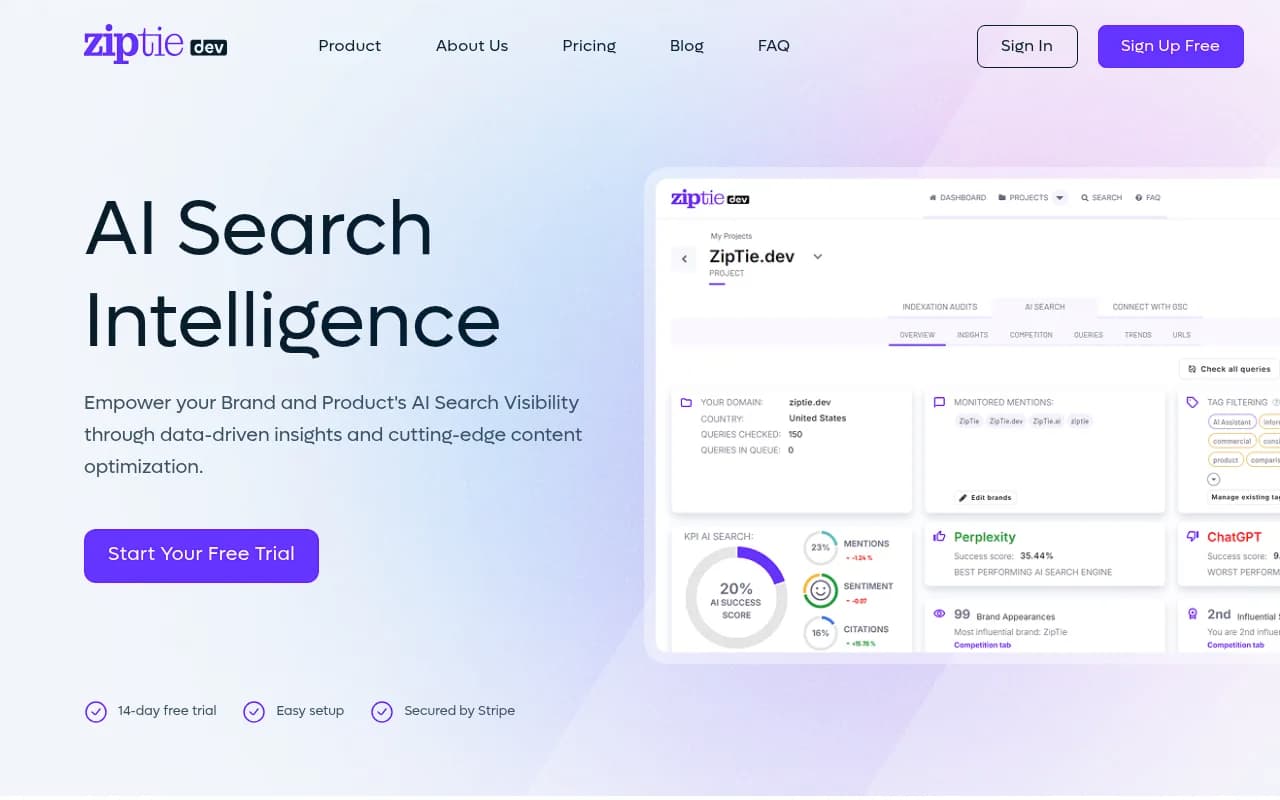
| ZipTie | Focused tracker | AI Overview tracking with a success score | Narrow AIO focus |
Promptwatch
Promptwatch tracks Google AI Overviews and AI Mode through the real user interface in each country, alongside ChatGPT, Gemini, Perplexity and others. The useful part for this topic is that it lets you split by engine, see which of your pages get cited, and then act on the gaps through its Action Board and Content Agent. The free AI Visibility Report is a no-login way to get a first read.
Semrush AI Visibility Toolkit
If your team already lives in Semrush, the toolkit tracks mentions, citations and share of voice by platform, and connects to Google Analytics and Search Console. Its reporting guide is also a good source for the executive report structure.
SE Ranking
SE Ranking monitors which queries trigger AI Overviews daily and shows your position within those snapshots, with source analysis on cited domains.
Ahrefs Brand Radar
Brand Radar adds AI citation tracking to Ahrefs, useful if your backlink and keyword workflow already sits there.
Otterly.AI and ZipTie
Both are narrower, cheaper-feeling options for monitoring. Otterly.AI's guide gives a clear tiered metric framework, and ZipTie focuses on AI Overview tracking with an aggregate success score.
If you want to compare more options, the GEO software directory at bestgeosoftware.com lists dozens of them.
How to choose a tool without getting fooled
Bullzeye's advice for vendor questions is worth borrowing. Ask these before you buy or renew:
- Do you report share of answers, position, or a composite score, and how is the composite calculated?
- How many runs per prompt do you do, and can I see the raw snapshots?
- Can I lock my query panel so the denominator doesn't change?
- Do you extract exact cited URLs, and by country?
- Can I export the data to merge with GA4?
Bullzeye also notes that each vendor picks its own prompt set, sample size, engine mix and counting rule, then reports one headline number. That is why two tools can disagree about the same brand. Pick one and stay consistent so you measure change, not tool differences.
Set up your measurement in five steps
- Build a locked panel. Pick 50 to 150 queries across your core topics, including commercial, informational and branded. Don't change it mid-quarter.
- Record the baseline. Run the panel several times to get trigger rate and citation rate per query.
- Add competitors. Choose two to four real rivals and track their citations on the same panel.
- Connect first-party data. Link Search Console and GA4 so impressions and sessions sit beside citations.
- Set the cadence. Weekly for trigger rate and citation rate, monthly for URL distribution and traffic impact, quarterly for revenue attribution and content gaps. This follows Otterly.AI's tiering.
Reporting template
Copy this into a spreadsheet or Looker Studio. It combines the Semrush report structure, Otterly.AI's tiers and Bullzeye's evidence discipline.
Page 1: Executive summary
| Metric | This month | Last month | Change | Evidence grade |
|---|---|---|---|---|
| Panel size (queries) | ||||
| Runs per query | ||||
| AI Overview trigger rate | ||||
| Citation rate (cited / triggered) | ||||
| Run-level consistency (avg appearance across runs) | ||||
| Share of voice vs top 2 competitors | ||||
| AI-related sessions (GA4) | ||||
| Conversions from those sessions |
The evidence grade column is Bullzeye's idea: label each number Exploratory, Directional, Supported or Decision-Grade depending on panel size and repeat runs. Bullzeye credits the IAB for the Exploratory, Directional and Decision-Grade terms, and Supported is its own middle tier. A number without its denominator is a claim, not a metric.
Page 2: Competitive position
| Top prompt | Your citation rate | Competitor A | Competitor B | Gain or loss |
|---|---|---|---|---|
Page 3: Cited pages
| URL | Content type | Citations this month | Trend (3 months) | Action |
|---|---|---|---|---|
Page 4: Gaps and actions
- Queries that trigger an AI Overview where you have no content
- Queries where you have content but aren't cited
- Queries where google.com surfaces (Business Profile, Merchant Center) are cited and you aren't present
- Next month's three priorities
Page 5: Business signal
Branded search volume, direct traffic trend and sign-up rate from pages that earn citations, compared over the same period. Silktide makes the case that brand mention frequency within AI responses predicts business impact better than SERP positions, and suggests asking customers how they first heard about you, since analytics tools miss that attribution.
Common mistakes
- Reporting one run. It tells you nothing about consistency.
- Mixing engines. AI Overviews, ChatGPT and Perplexity cite very different sources.
- Changing the panel. You lose the trend.
- Treating traffic as visibility. Semrush points out that traffic alone doesn't indicate AI visibility, since many AI answers produce no click.
- Reading month-to-date data as a trend. Promptwatch flags that it can exaggerate fast risers.
- Trusting a composite score you can't audit.
What to do with the numbers
Measurement only matters if it changes what you publish. If your citation rate is low where a trigger rate is high, you have a content or authority gap on those queries. If you are cited but your sessions are flat, look at the format and the snippet that gets surfaced. If competitors win on YouTube or Reddit-style sources, that is a channel gap rather than a page gap.
For tracking and fixing the gaps in one place, tools like Promptwatch can do both. If you'd rather hand the whole thing to specialists, 1001 SEO Media runs AI search and GEO programs for brands and uses Promptwatch for its own measurement.
Start small: 50 queries, a handful of competitors, a monthly page of results. Run it for three months before you draw conclusions.