Key takeaways
- AI share of voice is your slice of brand mentions (or citations) across a fixed set of prompts, engines, markets and runs. Change any of those inputs and the number changes.
- Track mention share and citation share as separate lines. They answer different questions: are you known, and are you trusted as a source.
- Do not blend engines. ChatGPT cites about 5 sources per web-search answer, Google AI Overviews and Perplexity about 10, so the slots you are competing for differ.
- Segment by prompt type. Branded, organic and competitor-comparison prompts behave differently, and mixing them muddies the benchmark.
- Vendor benchmark tables are heuristics. Your trend against named competitors is the number to report to leadership.
Why PR teams own this metric
Share of voice was a PR metric long before it was a GEO metric. You counted your coverage against competitors' coverage and reported a percentage. The AI version looks similar on a slide, but the inputs are different. A journalist writes an article. An AI engine assembles an answer from many sources, names a handful of brands, and moves on.
That matters for communications teams because the sources feeding those answers are largely earned media: review sites, listicles, forums, news and analyst pages. Shadow's 2026 guide on measuring AI share of voice makes the same point, framing the question as whether an engine retrieves, cites and absorbs your brand's content rather than whether a reporter covered you.
So PR is well placed to own the number. You already think in competitor sets, narrative and third-party validation. What you need is a measurement method that survives scrutiny when the CMO asks why the figure moved.
What AI share of voice actually measures
The plain definition: the percentage of AI-generated answers in a category that mention or cite your brand compared with competitors. If 100 relevant answers are generated and you appear in 28, that is a 28% visibility rate. Formulas differ in the details, though, and the details are where reports go wrong.
Two definitions are in circulation:
- Visibility rate: answers that include your brand divided by all answers. Answers with no brands still count in the denominator.
- Mention share: your brand's mention units divided by every tracked brand's mention units. Nike mentioned 280 times in a 1,000-mention set is a 28% share, as 5WPR's example shows.
The Trakkr definition is the most careful one I found: a tracked brand counts at most once per answer, even if named five times, and brand-free answers add no mention units. Whichever rule you pick, write it down and keep it. Switching counting rules halfway through a quarter produces a trend line that is really just a methodology change.
Mentions versus citations
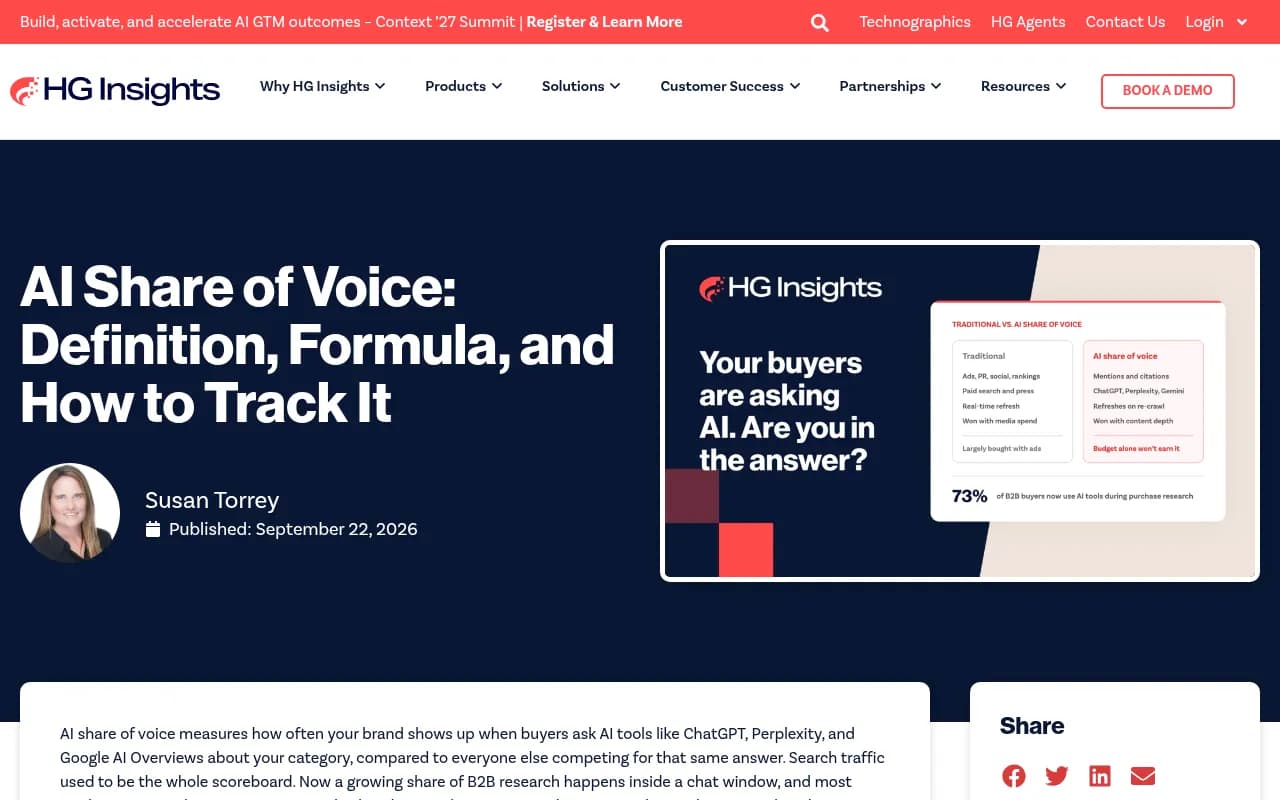
A mention is your brand named in the answer text. A citation is your website linked as a source. HG Insights draws the useful distinction: high mentions with low citations means the model knows you but does not trust your own pages as evidence. Low mentions with decent citations means your content is used but your brand is not being named.
For PR that split is gold. Mentions without self-citations usually mean other people's pages are doing the talking, which is an earned media story. Report both, separately.
Build the measurement design first
GrowthX's study guide says it bluntly: fix the prompts, engines, region, run count and counting rule before you track change. Answers vary between runs of the same prompt, so one reading from one engine on one day is a sample, not a ranking.
Choose the competitor set
Pick the three to ten brands your buyers actually compare you against. Include the one sales complains about and the one that keeps showing up in analyst notes. Auto-discovered competitors are useful, but be careful: if the tool adds brands to the denominator over time, your share can fall while your absolute visibility rises. Check absolute counts alongside the percentage.
Write the prompt set
Build the denominator from unbranded prompts that reflect real buying questions: category, comparison, problem and fit. Keep branded prompts out of the competitive denominator, or report them in their own block, since they test how engines describe you rather than whether you get shortlisted.
A workable starting structure:
- 30 to 50 organic category prompts ("best X for mid-market finance teams")
- 15 to 20 competitor-comparison prompts ("A vs B")
- 10 to 15 branded prompts, reported separately
- Prompts phrased by persona if your buyers differ by role
Run it more than once
Record the engine, region, language, date and whether the run used a fresh session. Run each prompt several times and report a range when results vary. A clean single number is nice for a slide, but a range is honest.
Segment by engine and prompt type
Promptwatch Data gives two numbers that should change how you slice the report.
First, citation slots differ by engine. In Promptwatch's average sources per response data, ChatGPT cites about 5 sources per web-search answer, Google AI Overviews about 10, and Perplexity almost exactly 10 every day. Copilot swung from under 2 to nearly 17 within weeks before settling low. A share figure from one engine is not comparable with another, so report per engine. Perplexity's stability also makes it a decent test bench: if your citations move there, your content probably caused it.
Second, prompt type changes how crowded the answer is. In Promptwatch's unique domains per ChatGPT response report (Sep 28 to Oct 4, 2026), 47.6% of responses cited 10 or more domains. Split by prompt type:
| Prompt type | Cite 10+ domains | Notes |
|---|---|---|
| Organic (no brand named) | 52.5% | Crowded answers, many sources compete |
| Competitor comparison | 49.1% | Competitor's site is often cited beside yours |
| Brand-specific | 21.3% | Most common count is 5 domains |
The practical read: on organic prompts you are one of many sources and share is hard to win. On branded prompts the answer is narrower and you have more control. Blend them and you hide both stories.
What the content-type data says about earned coverage
PR teams often assume news coverage is the lever. The data is more mixed. Promptwatch's ChatGPT citation share by content type report (Sep 28 to Oct 4, 2026) found product pages at 22.4% of citations, landing pages 16.8%, listicles 13.6%, how-to guides 8.7%, comparisons 5.9% and news 5.7%. Editorial formats combined were 43%.
For branded prompts, reviews (5.6%) and press releases (2.1%) earned a larger share than they do overall. And news ages fast: Promptwatch's content half-life report found news lost half its cited pages within 36 days of a July 6, 2026 snapshot, while landing pages and docs lasted far longer.
So a launch burst of coverage can lift your share for a few weeks and then fade. Evergreen third-party pages, such as review profiles, comparison pages and listicles that include you, hold their position longer. Plan the earned media calendar with that decay in mind.
What counts as a good number
Honestly, nobody knows. GrowthX notes that no analyst benchmark sets a good absolute SOV for AI answers, and published ESOV rules come mainly from paid media studies. Vendor ranges exist, though, and they are useful as rough orientation if you label them as such:
| Category type | Leader | Challenger | New entrant |
|---|---|---|---|
| Niche B2B (3 to 5 competitors) | 40-60% | 15-30% | 5-15% |
| Mid-market B2B (10 to 20 competitors) | 20-35% | 8-15% | 2-8% |
| Broad consumer (50+ competitors) | 10-20% | 3-8% | under 3% |
These are Shadow's figures. OptimizeGEO says 25-40% is competitive in most categories and under 15% signals a citation gap. They overlap loosely and none is independently validated.
A sturdier reference is the equal-share baseline: 100 divided by the number of tracked brands. With five brands, 20% is neutral. Above it you are over-indexing. Below it you are under-indexing. Then judge yourself by your trend per engine, prompt group and market. LLMpulse and others make the same call: the trend against named competitors beats the absolute score.
Diagnosing a gap
Read the metrics together instead of staring at one number:
- Low share of mentions across prompts is a coverage problem. You are not in enough third-party sources.
- Named late in the answer is a prominence problem. Track average position as well.
- Mentioned without your own domain cited points to a content or crawlability problem on your side.
- Mentioned with a negative or wrong description is a narrative problem. Pull the specific claims and check them.
- A competitor holds 40% overall but you beat them on the five prompts that drive pipeline. Prompt-level benchmarking tells you that, aggregate share does not.
When a competitor's share jumps, check absolute counts first. Then look for a cause: product news, a funded PR push, a new comparison page, a Reddit thread. Respond in the channel where they gained, not everywhere.
Tools for tracking AI share of voice
You can do a pilot in a spreadsheet: 40 prompts, three engines, five runs each, tallied by hand. It works for a first benchmark and gets painful by week three. After that you want a tool that runs prompts on a schedule against the real interfaces and stores the responses.
What a PR team should look for:
- Competitor benchmarking on the same prompt set
- Per-engine reporting, not one blended score
- Mention and citation tracked separately
- Prompt-type segmentation and persona support
- Exportable responses so you can audit the counting
- Sentiment or claim-level analysis
Promptwatch is the one I would put first for teams that want the whole loop. It tracks ChatGPT, Gemini, Perplexity, Google AI Overviews, Claude and others from the real interfaces, reports Visibility Score and Share of Voice with a defined counting rule (one mention per response per brand), and its Brand Narrative feature pulls the individual claims AI makes about you and competitors, which is the part PR cares about most. It also shows which Reddit threads, YouTube videos and third-party pages AI cites, then helps you act on the gaps. See how Promptwatch defines Share of Voice before you set up monitors.
Other options in the category:
| Tool | Strength | Consider if |
|---|---|---|
| Promptwatch | Tracking plus citation tracing, content gap actions, crawler logs and AI traffic | You want to fix gaps, not just report them |
| Profound | Enterprise monitoring and analytics | Budget is large and you mostly need reporting |
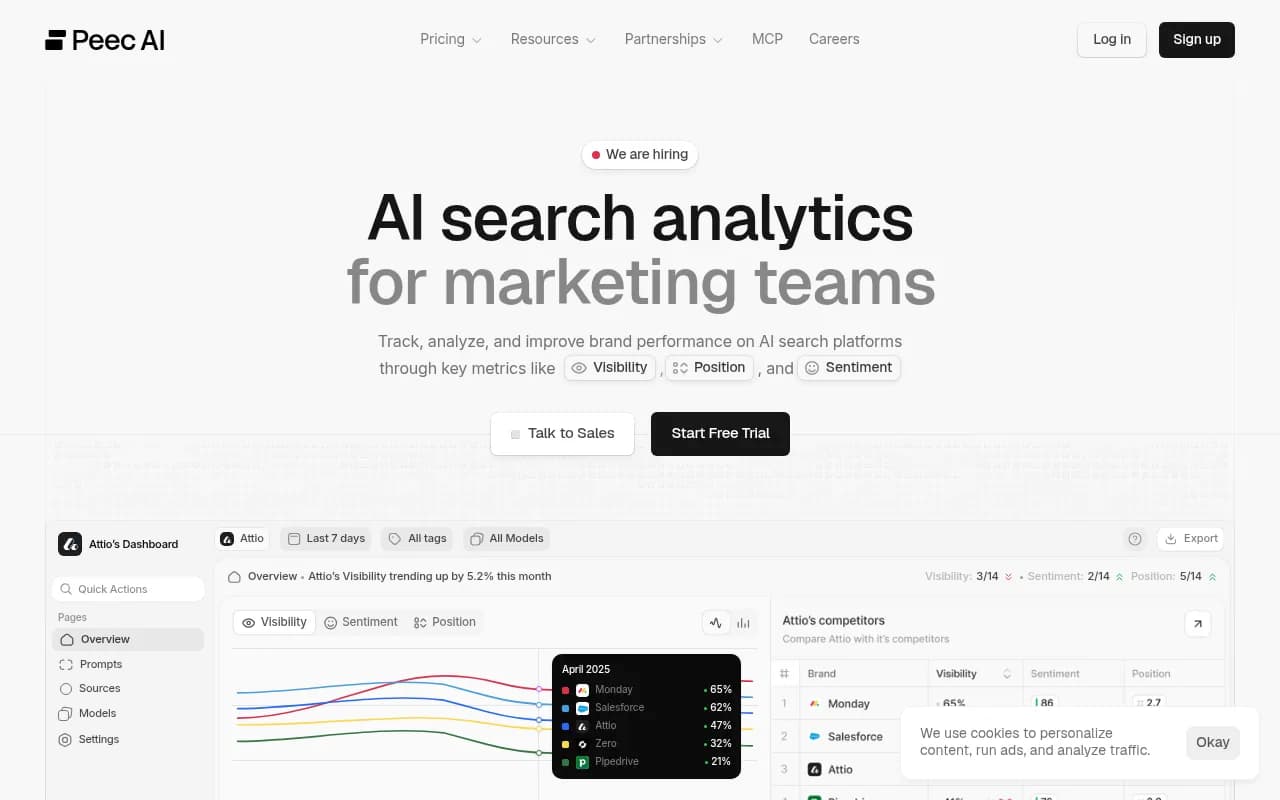
| Peec AI | Lightweight tracking with suggestions | You need a simple prompt tracker |
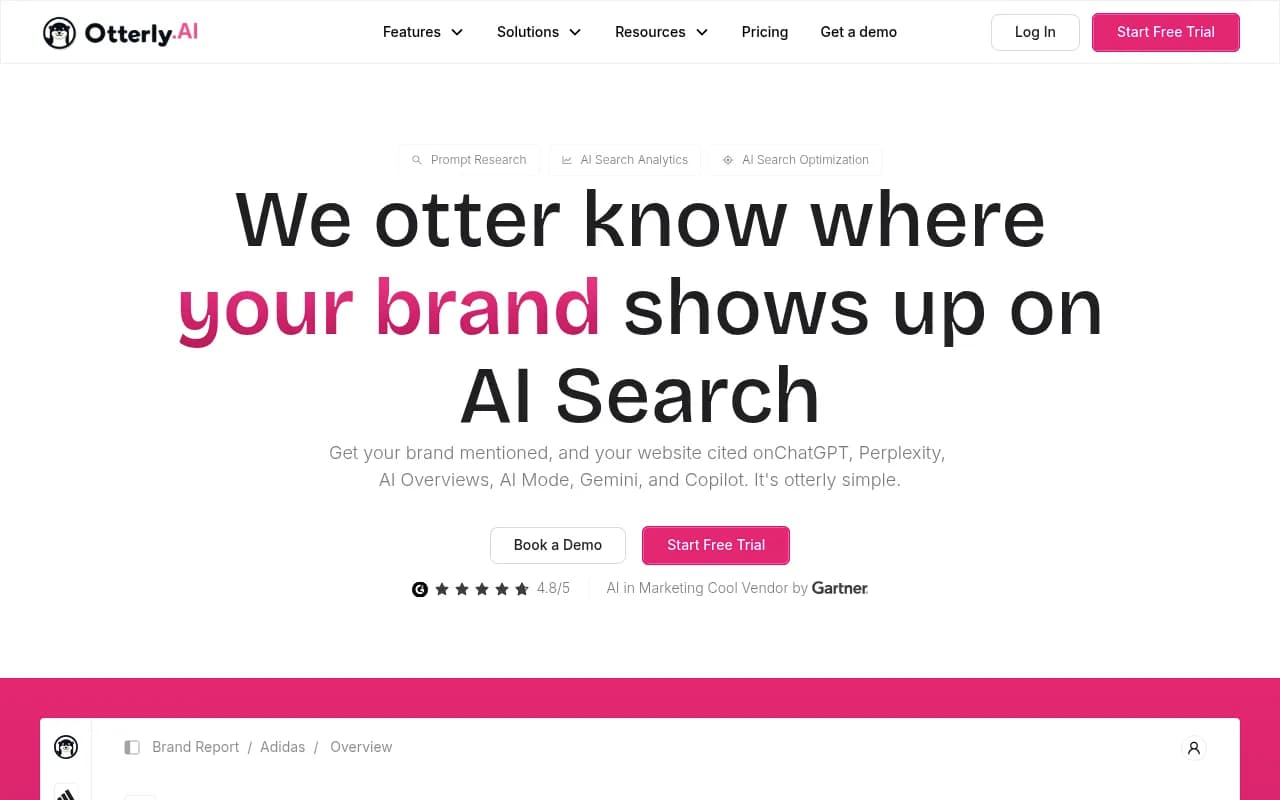
| Otterly.AI | Affordable monitoring | Small team, basic needs |
| Semrush AI Visibility Toolkit | Sits inside an existing SEO suite | You already live in Semrush |
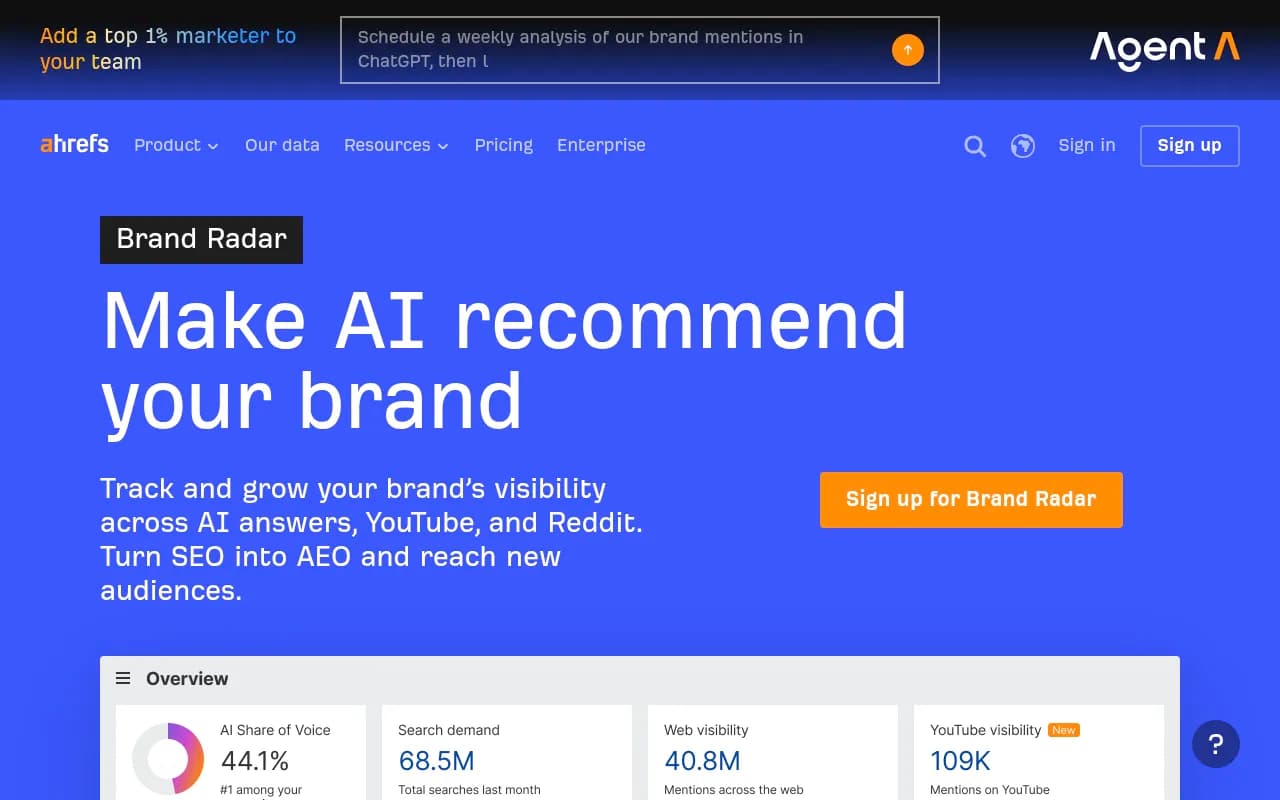
| Ahrefs Brand Radar | Brand tracking next to Ahrefs data | You already use Ahrefs |
| Trakkr | Mention share calculator and visitor tracing | You want a free calculator to start |
Be aware that denominator rules differ by vendor. One tool divides by total brand mentions, another by responses, another weights by search volume. If you compare numbers across tools you are comparing methods. For more options, the GEO software directory at bestgeosoftware.com lists a wider set.
A reporting template for leadership
Keep the monthly report to one page.
- Methodology line: prompt count, engines, markets, run count, counting rule.
- Mention share per engine, you versus each named competitor, with the equal-share baseline marked.
- Citation share per engine, shown separately.
- Prompt-type split: organic, comparison, branded.
- Three biggest movers and the likely cause.
- Narrative check: top claims AI makes about you, flagged accurate or inaccurate.
- Next actions tied to specific gaps.
The trend matters more than any single month. SOV in AI search shifts faster than traditional rankings, so monthly tracking is the minimum, and weekly is better during a launch.
Raising your share once you have the baseline
Start with answer-gap analysis: list the prompts where competitors appear and you do not, then see which pages are cited in those answers. Those pages are your PR target list. Typical moves:
- Get included in the listicles and comparison pages that already get cited, instead of only chasing news.
- Fix reviews and directory profiles, which show up more in branded prompts.
- Publish proprietary data and clear product and landing pages on your own domain, since those content types lead citations.
- Correct wrong claims at the source page, not in the chatbot.
- Expect competitor comparison prompts to cite your rival's site next to yours, and make sure your own comparison page is accurate.
If you want a quick outside read on where you stand, Promptwatch's free AI visibility report scans how ChatGPT, Gemini and Perplexity describe your brand without a login.
Common mistakes
- Blending engines into one score.
- Including branded prompts in the competitive denominator.
- Reading one run as truth.
- Changing the competitor set mid-quarter without restating prior months.
- Reporting share only, with no absolute counts.
- Treating vendor benchmark ranges as industry standards.
Pick the method, write it on the first slide, and hold it still for a quarter. The first number will not be flattering or even especially accurate. The second and third, measured the same way, will tell you whether your PR work is moving anything.